. 2017 Dec 1;9(12):3373-3383.
doi: 10.1093/gbe/evx256.

High-Resolution Single-Cell Sequencing of Malaria Parasites

Affiliations

High-Resolution Single-Cell Sequencing of Malaria Parasites

Simon G Trevino et al. Genome Biol Evol. .

Abstract

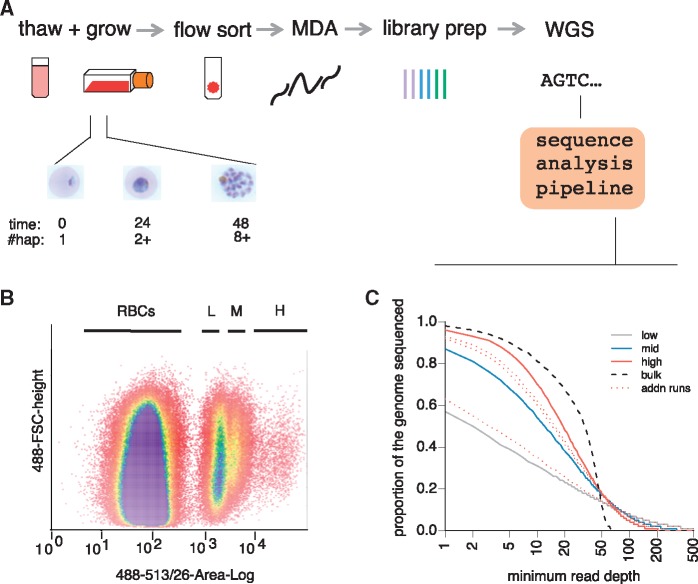
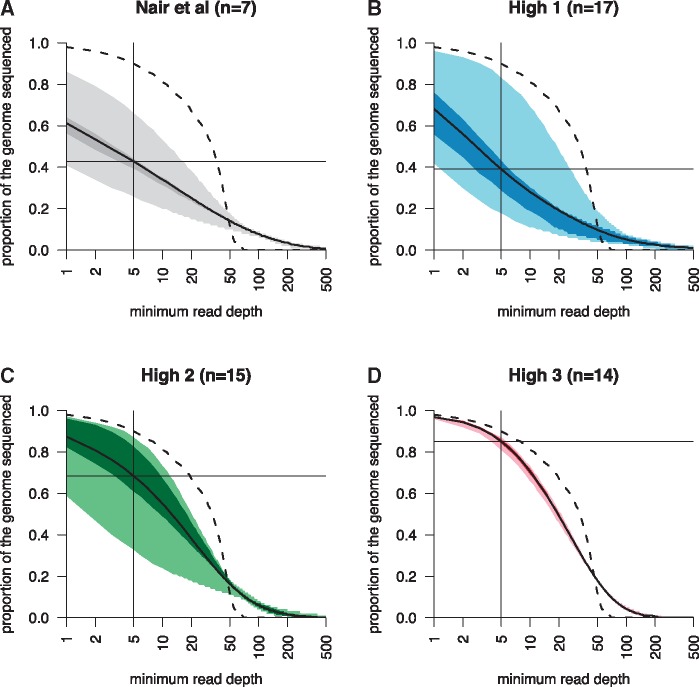
Single-cell genomics is a powerful tool for determining the genetic architecture of complex communities of unicellular organisms. In areas of high transmission, malaria patients are often challenged by the activities of multiple Plasmodium falciparum lineages, which can potentiate pathology, spread drug resistance loci, and also complicate most genetic analysis. Single-cell sequencing of P. falciparum would be key to understanding infection complexity, though efforts are hampered by the extreme nucleotide composition of its genome (∼80% AT-rich). To counter the low coverage achieved in previous studies, we targeted DNA-rich late-stage parasites by Fluorescence-Activated Cell Sorting and whole genome sequencing. Our method routinely generates accurate, near-complete capture of the 23 Mb P. falciparum genome (mean breadth of coverage 90.7%) at high efficiency. Data from 48 single-cell genomes derived from a polyclonal infection sampled in Chikhwawa, Malawi allowed for unambiguous determination of haplotype diversity and recent meiotic events, information that will aid public health efforts.

Keywords: malaria; methods; single-cell genomics.


Figures

<sc>Fig</sc>. 1.
Fig. 1.
—Targeted single-cell genomics of late-stage malaria parasites. (A) Cryopreserved iRBCs are thawed and grown under standard conditions for 40 h, generating late-stage parasites with multiple genome copies. DNA-stained iRBCs are sorted into individual tubes by FACS. To generate high quality reactions, high DNA content, late-stage parasites in the H gate are freeze–thaw lysed prior to MDA, library preparation and WGS. (B) An asynchronous culture of HB3 containing parasites with different amounts of DNA. The x-axis shows the fluorescence intensity, and the y-axis the size of each cell. (C) Genome coverage obtained by sequencing cells from the L, M, and H gates. The plot shows the proportion of the genome (y-axis) sequenced to at least a given minimum read depth (x-axis). The black dashed line is data obtained by routine sequencing of high quality DNA from a laboratory derived line. The solid lines denote cells from the L (grey), M (blue), and H (red) gates, with dotted red lines additional cells from the H gate. All libraries were downsampled to 30× coverage for comparability.
<sc>Fig</sc>. 2.
Fig. 2.
—Comparison of genome coverage for single-cell WGS libraries. Each plot shows the same statistic as in figure 1C, including the median value (solid line) with the interquartile range (dark shading), and the range (light shading). Genome coverage as a function of read depth from WGS data collected by previous work THB0 (A) or H gate-sorted cells grown for 40 h from THB2 (B), MAW0 (C), (D). (A)–(C) were processed by REPLI-g and KAPA HyperPlus library preparation with PCR amplification. (C) and (D) were sorted into sterilized PBS (Lonza) and (D) was processed with the QIAseq FX single-cell DNA Kit. All libraries were downsampled to 30× coverage for comparability.
<sc>Fig</sc>. 3.
Fig. 3.
—Estimation of the number of unique haplotypes in a complex infection. (A) The number of unique haplotypes observed in MAW0 using an increasingly permissive threshold for pairwise differences. The vertical red line shows the point at which we estimate few errors will define new haplotypes whereas the horizontal red line shows the estimated number of haplotypes at this threshold. (B) Rarefaction curve for 43 single cells from the MAW0 infection, 95% confidence interval in dashed black line. The red dashed line is the estimated number of haplotypes from (A).
<sc>Fig</sc>. 4.
Fig. 4.
—Relatedness of individual parasites. (A) UPGMA tree of pairwise allele sharing (left) and proportion of genome IBD between individual parasites (right) in the MAW0 infection. The haplotypes inferred in figure 3A are shown in matching colors in the lines joining the tree branches. (B) Relationship between total fraction of IBD and IBD length between parasites. Parasites from identical haplotype groups shared IBD across nearly the entire genome (dots in the upper right), conversely parasites from the most distantly separated haplotype groups (i.e., red vs. dark grey) shared near zero IBD (dots in the bottom left). (C) SNP map of chromosome 14 for the 7 consensus haplotypes. (D) The number of SNP differences in 20 SNP windows in pairwise comparisons between haplotypes. The haplotypes compared for each colored line are denoted by dots in (C).
<sc>Fig</sc>. 5.
Fig. 5.
—Frequency of alleles detected in bulk DNA at time of thaw and pooled single-cell library data. 9,766 unfixed sites with a read depth of at least 50× in the bulk sample, and had genotype calls for 80% of the single cell sequences were used to estimate sampling bias. A histogram showing the raw counts for each group is attached to the relevant axis. A contour map is overlaid the scatterplot to highlight the density of points lying along the diagonal.
<sc>fig</sc>. 6.
fig. 6.
—Unique mutations from single-cell sequencing can be used to infer haplotype abundance in bulk genome sequence. (A) Unique mutations from each haplotype group were used to estimate the bias in estimating their abundance in the single-cell sampling. The interquartile range of the allele frequencies for each haplotype is shown by black bars surrounding each plot. These unique allele frequencies were used to correct the haplotype abundances. The original comparison between bulk and single cell allele frequencies ((B); a replicate of fig. 5) and (C) the corrected data.

References

    1. Amambua-Ngwa A, et al.2012. Population genomic scan for candidate signatures of balancing selection to guide antigen characterization in malaria parasites. PLoS Genet. 8(11):e1002992. - PMC - PubMed
    1. Assefa SA, et al.2014. estMOI: estimating multiplicity of infection using parasite deep sequencing data. Bioinformatics 30(9):1292–1294.http://dx.doi.org/10.1093/bioinformatics/btu005 - DOI - PMC - PubMed
    1. Auton A, McVean G.. 2007. Recombination rate estimation in the presence of hotspots. Genome Res. 17(8):1219–1227.http://dx.doi.org/10.1101/gr.6386707 - DOI - PMC - PubMed
    1. Blake DP, et al.2015. Population, genetic, and antigenic diversity of the apicomplexan Eimeria tenella and their relevance to vaccine development. Proc Natl Acad Sci U S A. 112(38):E5343–E5350. - PMC - PubMed
    1. Bourgon R. 2015. Intervals: Tools for Working with Points and Intervals.

Publication types