

Downregulation of Survivin contributes to cell-cycle arrest during postnatal cardiac development in a severe spinal muscular atrophy mouse model
- PMID: 29220503
- PMCID: PMC5886172
- DOI: 10.1093/hmg/ddx418
Downregulation of Survivin contributes to cell-cycle arrest during postnatal cardiac development in a severe spinal muscular atrophy mouse model
Abstract
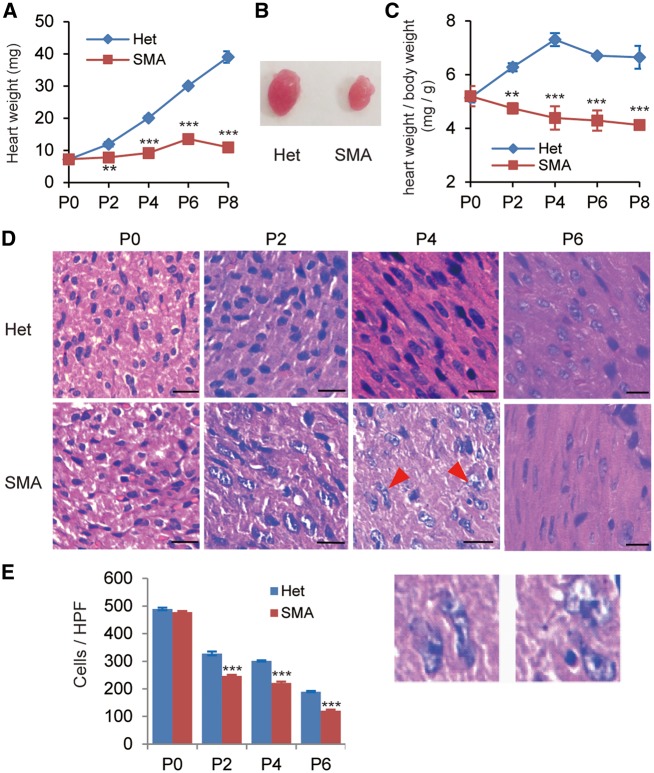
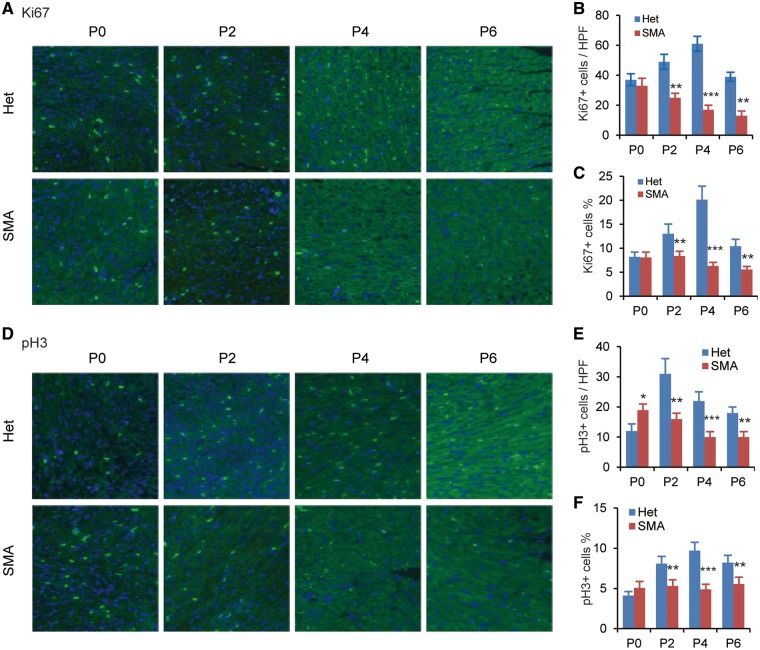
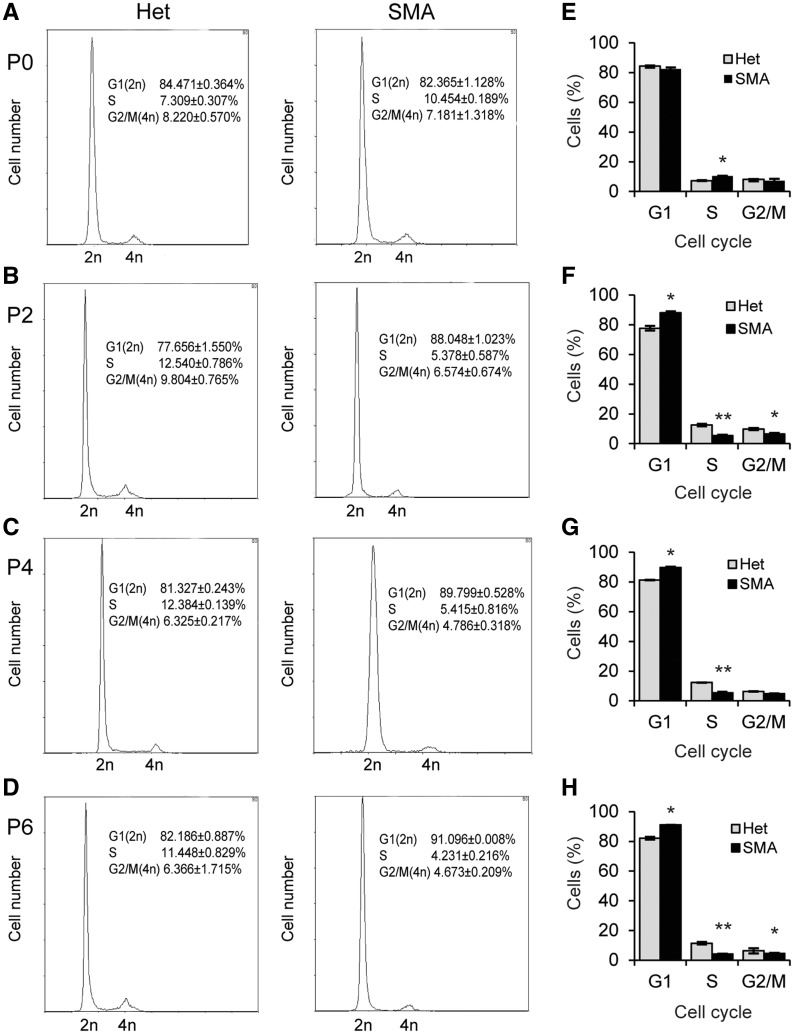
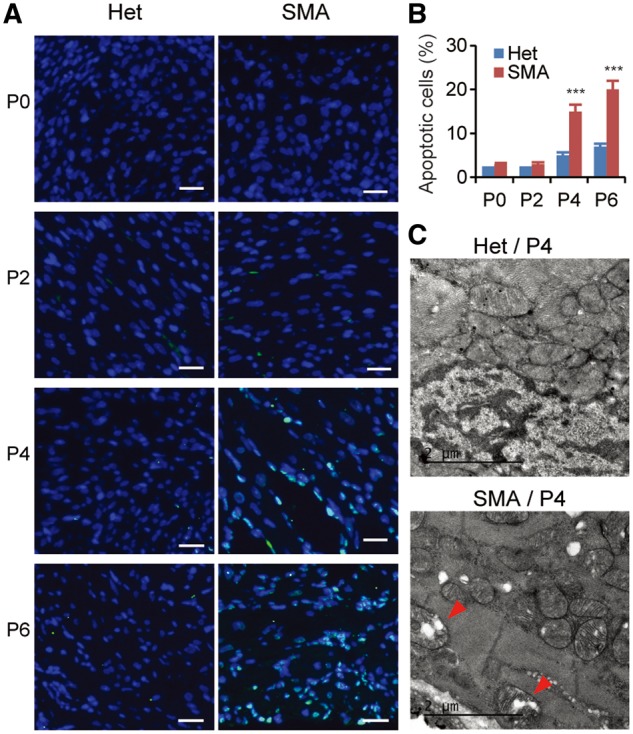
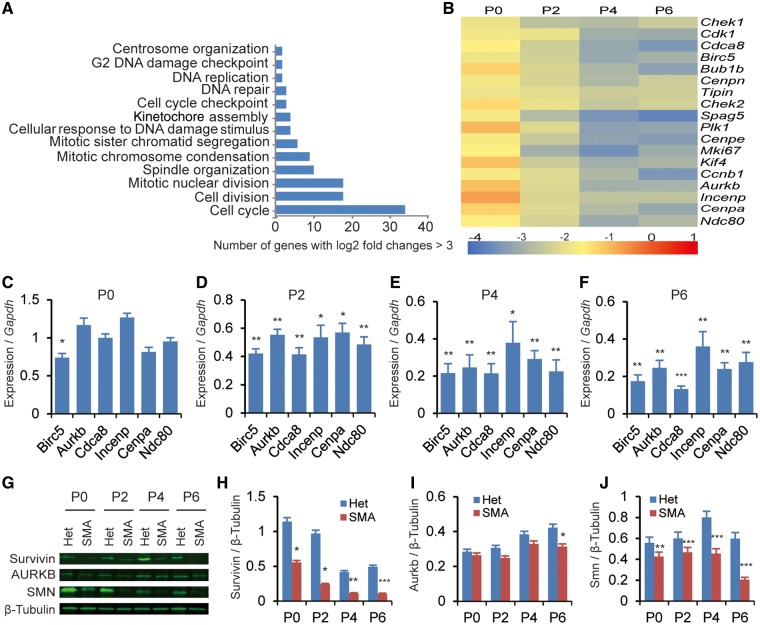
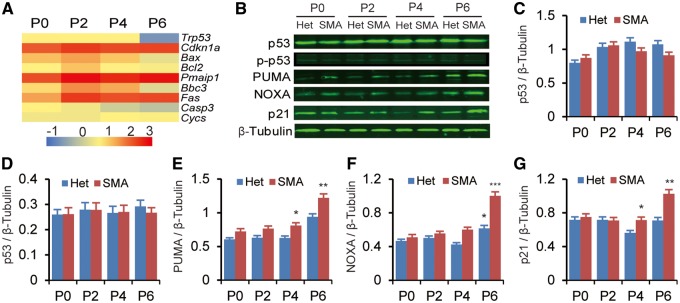
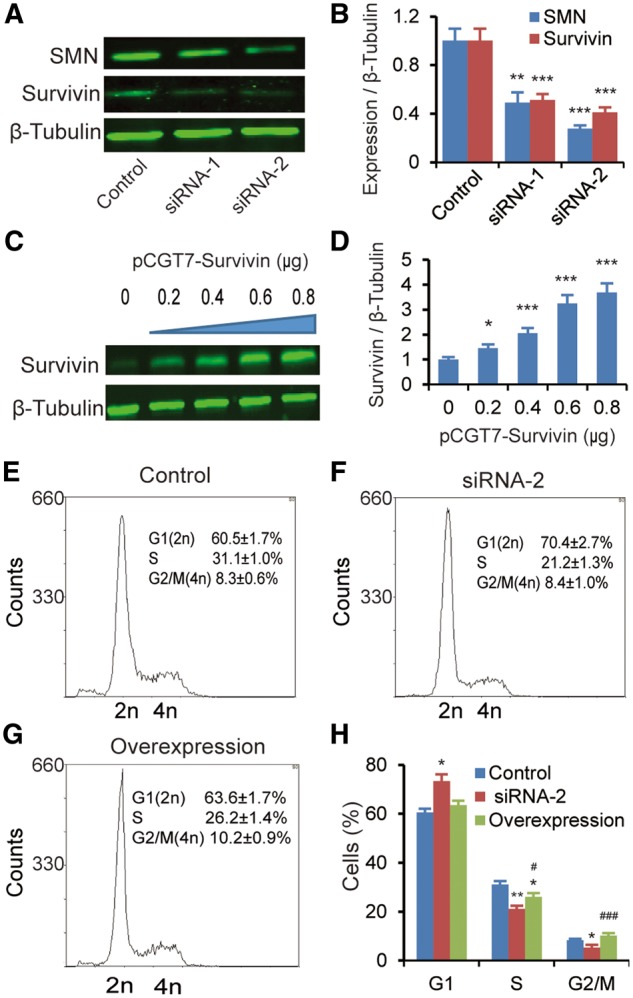
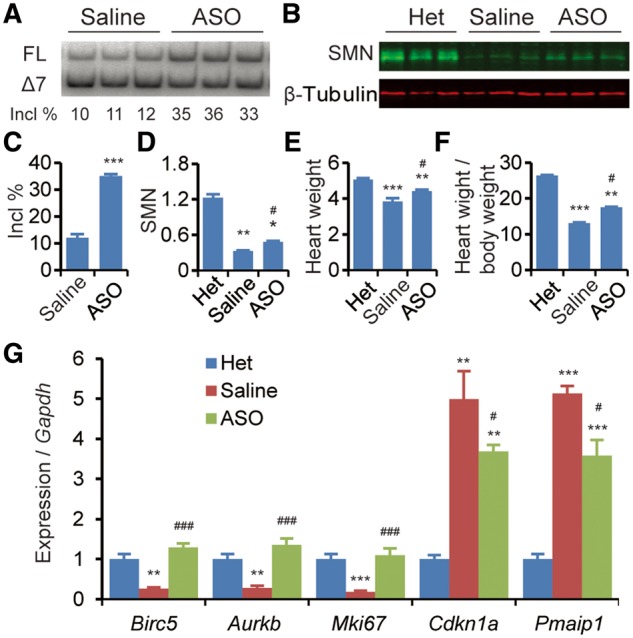
Spinal muscular atrophy (SMA) is the leading genetic cause of infant mortality, characterized by progressive degeneration of spinal-cord motor neurons, leading to atrophy of skeletal muscles. However, accumulating evidence indicates that it is a multi-system disorder, particularly in its severe forms. Several studies delineated structural and functional cardiac abnormalities in SMA patients and mouse models, yet the abnormalities have been primarily attributed to autonomic dysfunction. Here, we show in a severe mouse model that its cardiomyocytes undergo G0/G1 cell-cycle arrest and enhanced apoptosis during postnatal development. Microarray and real-time RT-PCR analyses revealed that a set of genes associated with cell cycle and apoptosis were dysregulated in newborn pups. Of particular interest, the Birc5 gene, which encodes Survivin, an essential protein for heart development, was down-regulated even on pre-symptomatic postnatal day 0. Interestingly, cultured cardiomyocytes depleted of SMN recapitulated the gene expression changes including downregulation of Survivin and abnormal cell-cycle progression; and overexpression of Survivin rescued the cell-cycle defect. Finally, increasing SMN in SMA mice with a therapeutic antisense oligonucleotide improved heart pathology and recovered expression of deregulated genes. Collectively, our data demonstrate that the cardiac malfunction of the severe SMA mouse model is mainly a cell-autonomous defect, caused by widespread gene deregulation in heart tissue, particularly of Birc5, resulting in developmental abnormalities through cell-cycle arrest and apoptosis.
© The Author(s) 2017. Published by Oxford University Press. All rights reserved. For Permissions, please email: journals.permissions@oup.com.
Figures
Similar articles
-
A cell-autonomous defect in skeletal muscle satellite cells expressing low levels of survival of motor neuron protein.Dev Biol. 2012 Aug 15;368(2):323-34. doi: 10.1016/j.ydbio.2012.05.037. Epub 2012 Jun 15. Dev Biol. 2012. PMID: 22705478 Free PMC article.
-
Recapitulation of spinal motor neuron-specific disease phenotypes in a human cell model of spinal muscular atrophy.Cell Res. 2013 Mar;23(3):378-93. doi: 10.1038/cr.2012.166. Epub 2012 Dec 4. Cell Res. 2013. PMID: 23208423 Free PMC article.
-
The Antisense Transcript SMN-AS1 Regulates SMN Expression and Is a Novel Therapeutic Target for Spinal Muscular Atrophy.Neuron. 2017 Jan 4;93(1):66-79. doi: 10.1016/j.neuron.2016.11.033. Epub 2016 Dec 22. Neuron. 2017. PMID: 28017471 Free PMC article.
-
The Biochemistry of Survival Motor Neuron Protein Is Paving the Way to Novel Therapies for Spinal Muscle Atrophy.Biochemistry. 2020 Apr 14;59(14):1391-1397. doi: 10.1021/acs.biochem.9b01124. Epub 2020 Apr 2. Biochemistry. 2020. PMID: 32227847 Review.
-
Spinal muscular atrophy: antisense oligonucleotide therapy opens the door to an integrated therapeutic landscape.Hum Mol Genet. 2017 Oct 1;26(R2):R151-R159. doi: 10.1093/hmg/ddx215. Hum Mol Genet. 2017. PMID: 28977438 Review.
Cited by
-
Survivin is a prognostic indicator in glioblastoma and may be a target of microRNA-218.Oncol Lett. 2019 Jul;18(1):359-367. doi: 10.3892/ol.2019.10335. Epub 2019 May 7. Oncol Lett. 2019. PMID: 31289507 Free PMC article.
-
New Perspectives of Underlying Cardiomyopathy in Pediatric SMA Patients-An Age Matched Control Study.Life (Basel). 2025 Jul 11;15(7):1091. doi: 10.3390/life15071091. Life (Basel). 2025. PMID: 40724593 Free PMC article.
-
Rescue of spinal muscular atrophy mouse models with AAV9-Exon-specific U1 snRNA.Nucleic Acids Res. 2019 Aug 22;47(14):7618-7632. doi: 10.1093/nar/gkz469. Nucleic Acids Res. 2019. PMID: 31127278 Free PMC article.
-
Mitochondrial Dysfunction in Spinal Muscular Atrophy.Int J Mol Sci. 2022 Sep 17;23(18):10878. doi: 10.3390/ijms231810878. Int J Mol Sci. 2022. PMID: 36142791 Free PMC article. Review.
-
Antisense Oligonucleotide Induction of the hnRNPA1b Isoform Affects Pre-mRNA Splicing of SMN2 in SMA Type I Fibroblasts.Int J Mol Sci. 2022 Apr 1;23(7):3937. doi: 10.3390/ijms23073937. Int J Mol Sci. 2022. PMID: 35409296 Free PMC article.
References
-
- Crawford T.O., Pardo C.A. (1996) The neurobiology of childhood spinal muscular atrophy. Neurobiol. Dis., 3, 97–110. - PubMed
-
- Lefebvre S., Burglen L., Reboullet S., Clermont O., Burlet P., Viollet L., Benichou B., Cruaud C., Millasseau P., Zeviani M. (1995) Identification and characterization of a spinal muscular atrophy-determining gene. Cell, 80, 155–165. - PubMed
-
- Meister G., Buhler D., Pillai R., Lottspeich F., Fischer U. (2001) A multiprotein complex mediates the ATP-dependent assembly of spliceosomal U snRNPs. Nat. Cell Biol., 3, 945–949. - PubMed
Publication types
MeSH terms
Substances
Grants and funding
LinkOut - more resources
Full Text Sources
Other Literature Sources
Molecular Biology Databases
