. 2018 May 1;34(9):1441-1447.
doi: 10.1093/bioinformatics/btx777.

Integrating 5hmC and gene expression data to infer regulatory mechanisms

Affiliations

Integrating 5hmC and gene expression data to infer regulatory mechanisms

Cristina Mitrea et al. Bioinformatics. .

Abstract

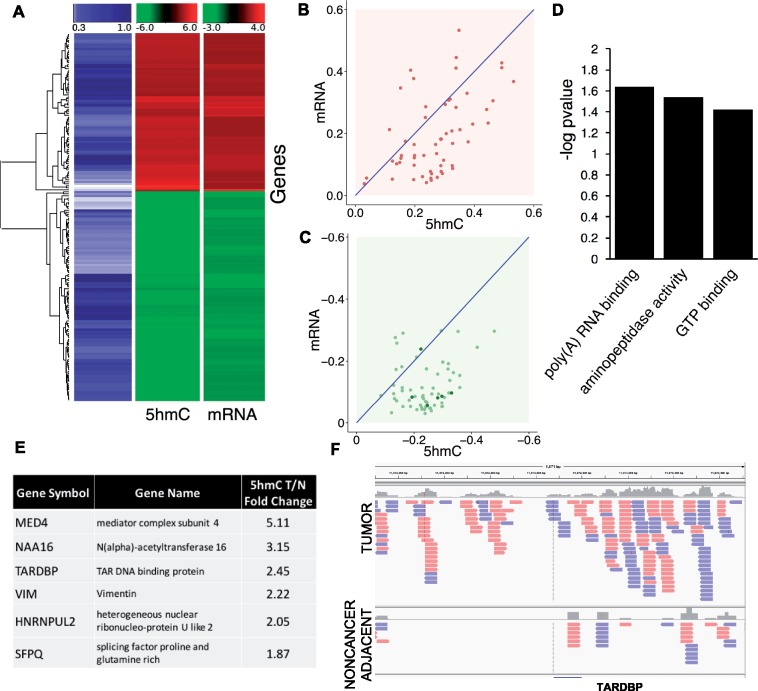
Motivation: Epigenetic mechanisms are known to play a major role in breast cancer. However, the role of 5-hydroxymethylcytosine (5hmC) remains understudied. We hypothesize that 5hmC mediates redox regulation of gene expression in an aggressive subtype known as triple negative breast cancer (TNBC). To address this, our objective was to highlight genes that may be the target of this process by identifying redox-regulated, antioxidant-sensitive, gene-localized 5hmC changes associated with mRNA changes in TNBC cells.

Results: We proceeded to develop an approach to integrate novel Pvu-sequencing and RNA-sequencing data. The result of our approach to merge genome-wide, high-throughput TNBC cell line datasets to identify significant, concordant 5hmC and mRNA changes in response to antioxidant treatment produced a gene set with relevance to cancer stem cell function. Moreover, we have established a method that will be useful for continued research of 5hmC in TNBC cells and tissue samples.

Availability and implementation: Data are available at Gene Expression Omnibus (GEO) under accession number GSE103850.

Contact: bollig@karmanos.org.


Figures

Fig. 1.
Fig. 1.
Workflow of the integrative analysis for gene expression and 5-hydroxymethylation (5hmC). The integrative analysis aims to discover genes regulated by 5hmC in breast cancer. In step 1, we select transcripts that have both significantly different gene expression and significantly different 5hmC levels. In step 2, we apply a correlation filter where correlation denotes concordant gene expression and 5hmC (both up or both down). In step 3, we apply a high correlation filter based on a distance statistic computed to assess the relevant magnitude of change in gene expression and 5hmC. The output is a list of highly correlated/concordant genes
Fig. 2.
Fig. 2.
Correlated 5hmC and mRNA expression changes induced by antioxidant treatment of TNBC cells. (A) Heat map of 182 genes showing correlated 5hmC and mRNA changes induced by antioxidant treatment of the MDA-MB-468 TNBC cell line. The blue column reflects the correlation value (from 30 to 100%). 5hmC and mRNA levels were the average of 3 biological replicates, treated versus untreated differences (P<0.05), according to Pvu-seq and RNA-seq analyses. (B) 59 genes with the highly correlated (75–100%) 5hmC and mRNA changes increased by antioxidant treatment. (C) 63 genes with the highly correlated (75–100%) 5hmC and mRNA changes decreased by antioxidant treatment. The 6 genes listed in panel (E) are denoted by dark green points. (D) The iPathwayGuide Gene Ontology analysis tool was applied to the highly correlated gene results to identify significant molecular function associations. (E) The highly correlated genes that overlapped with genes identified in differential analysis of 5hmC levels in TNBC patient samples. Each of the genes listed are denoted by dark green points in panel (C) and showed significantly higher 5hmC levels in a patient TNBC sample relative to matched adjacent noncancer tissue. (F) Integrative Genomics Viewer (IGV) display of tiled reads region of the genome surrounding the transcription start site of the DNA and RNA binding protein gene TARDBP. Peak enrichment in the patient tumor specimen (top panel) is absent in the noncancer adjacent specimen (lower panel)
Fig. 3.
Fig. 3.
Antioxidant treatment induced changes to 5hmC distribution across genomic regions in TNBC cells. For each genomic region, coverage was defined as the percentage of all bases within the entire genomic element that had a sequence-read mapped to it. Regions were defined according to the University of California, Santa Cruz (UCSC) Genome Browser
Fig. 4.
Fig. 4.
TET1 mRNA expression in TNBC. Low TET1 mRNA expression in TNBC tumor specimens (black) is associated with better patient outcomes (longer relapse free survival time). Results from a query using the on-line KM Plotter database and analysis tool (Győrffy et al., 2013)

References

    1. Ahsan S., Drăghici S. (2017) Identifying significantly impacted pathways and putative mechanisms with iPathwayGuide. Curr Protoc Bioinformatics, 57, 7–15. - PubMed
    1. Anders S., Huber W. (2010) Differential expression analysis for sequence count data. Genome Biol., 11, R106.. - PMC - PubMed
    1. Anders S. et al. (2015) HTSeq—a Python framework to work with high-throughput sequencing data. Bioinformatics, 31, 166–169. - PMC - PubMed
    1. Bao B. et al. (2017) Treating triple negative breast cancer cells with erlotinib plus a select antioxidant overcomes drug resistance by targeting cancer cell heterogeneity. Sci. Rep., 7, 44125. - PMC - PubMed
    1. Bhattacharyya S. et al. (2013) Genome-wide hydroxymethylation tested using the HELP-GT assay shows redistribution in cancer. Nucl. Acids Res., 41, e157. - PMC - PubMed

Publication types