. 2018 Jun;67(6):2271-2286.
doi: 10.1002/hep.29715. Epub 2018 Apr 20.

Significance and mechanism of androgen receptor overexpression and androgen receptor/mechanistic target of rapamycin cross-talk in hepatocellular carcinoma

Affiliations

Significance and mechanism of androgen receptor overexpression and androgen receptor/mechanistic target of rapamycin cross-talk in hepatocellular carcinoma

Hong Zhang et al. Hepatology. 2018 Jun.

Abstract

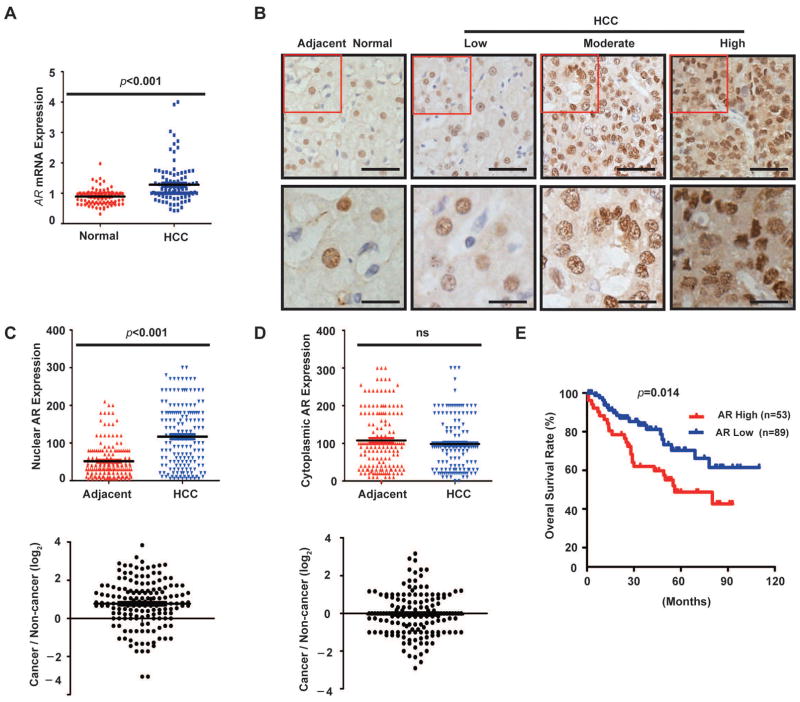
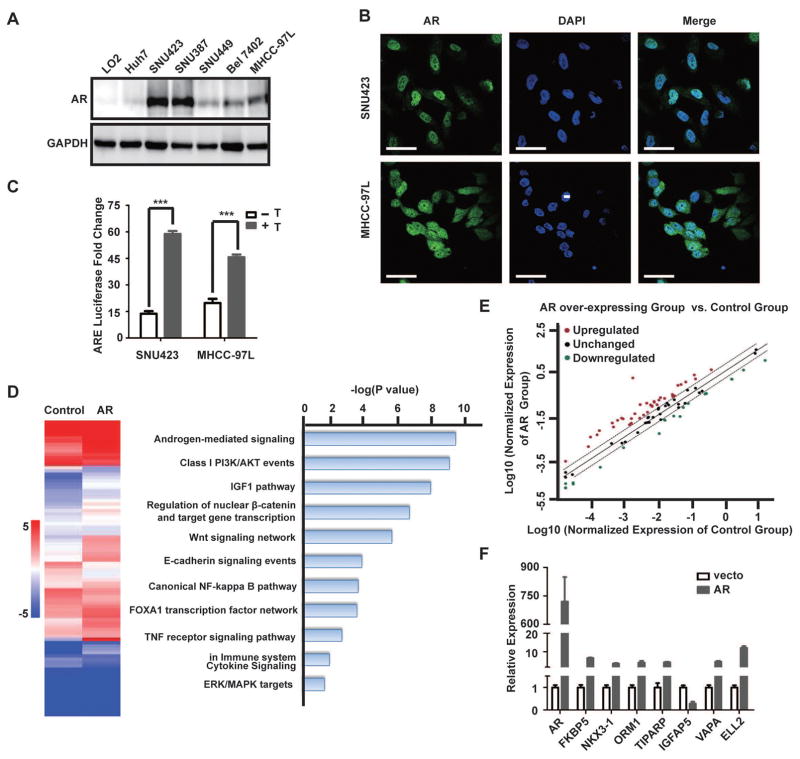
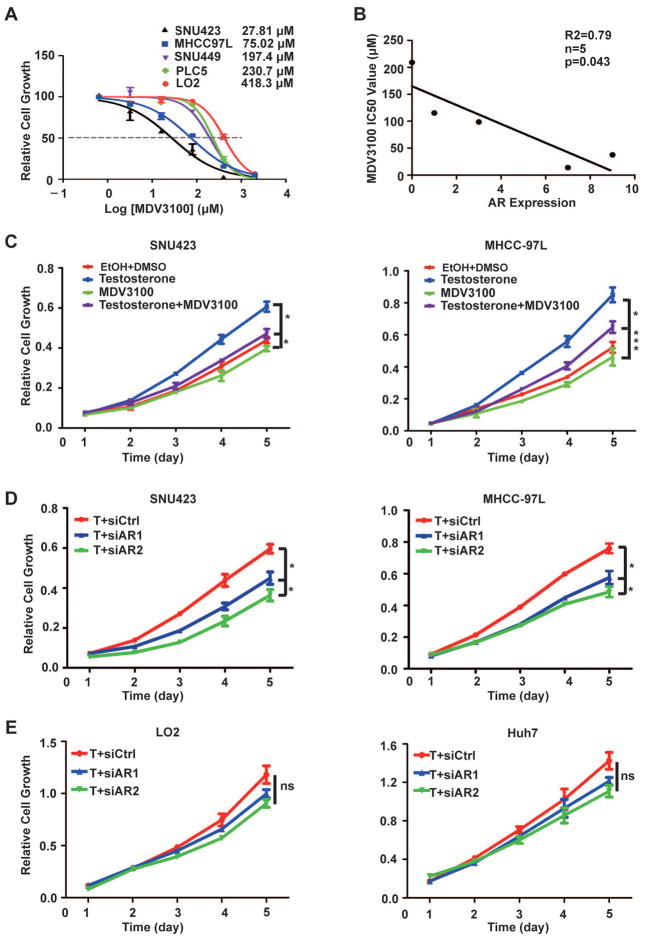
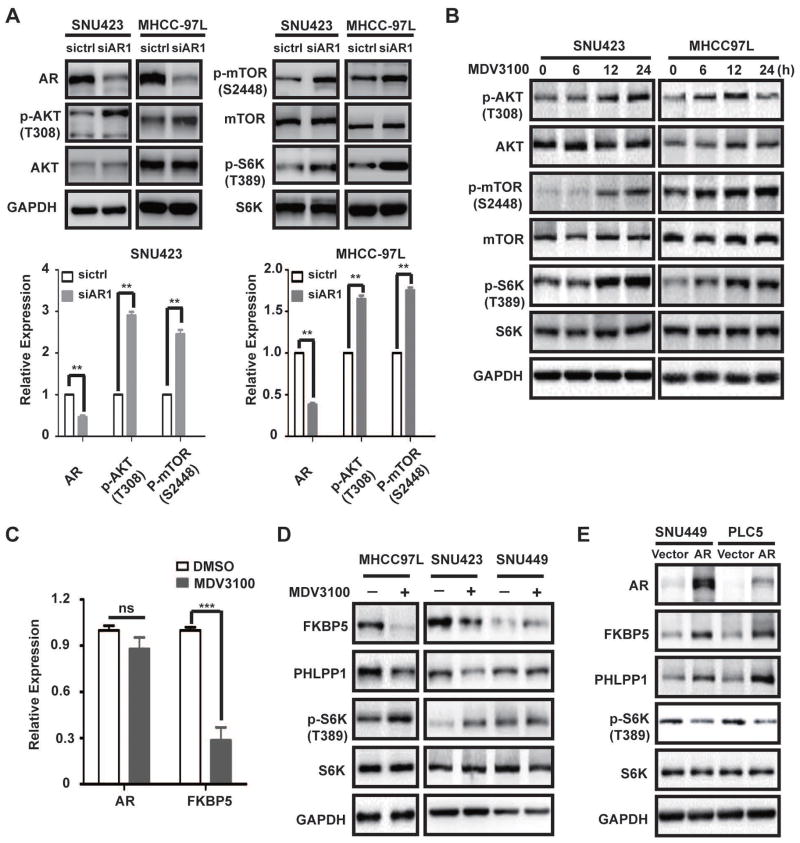
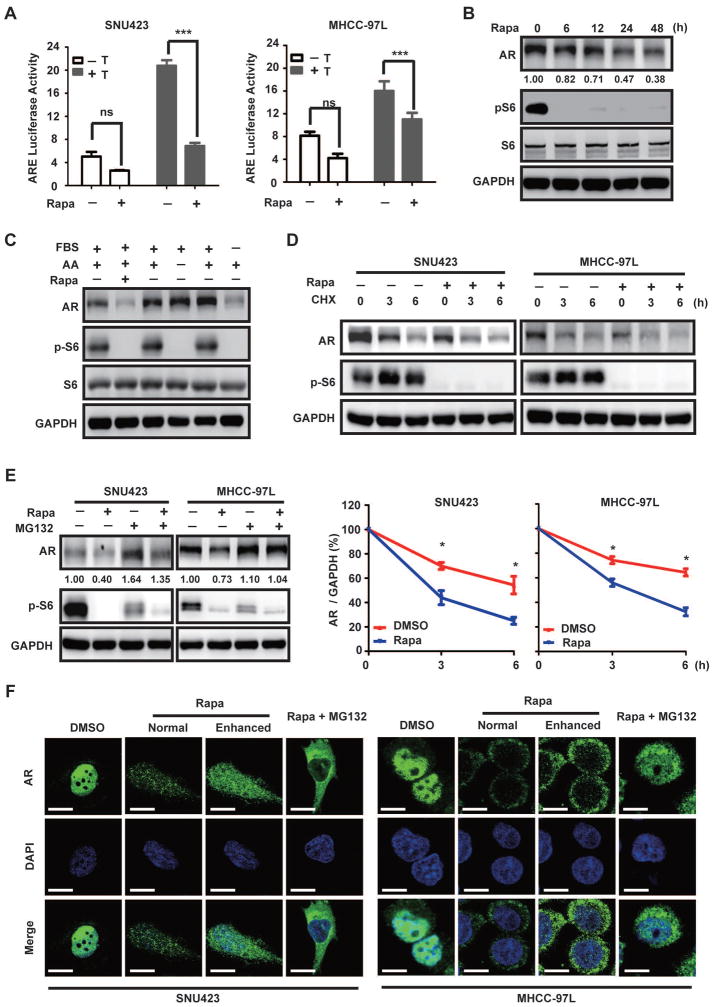
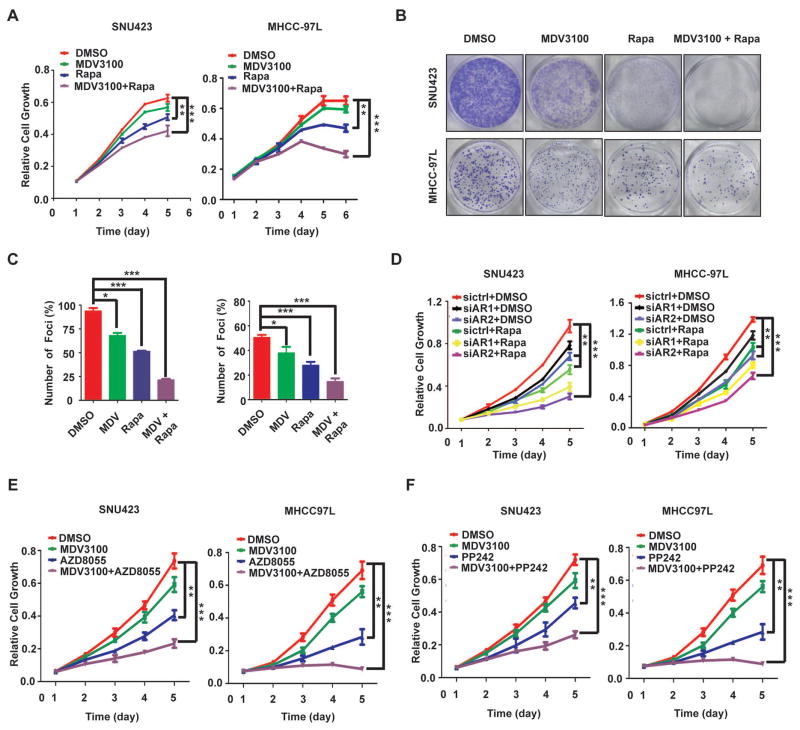
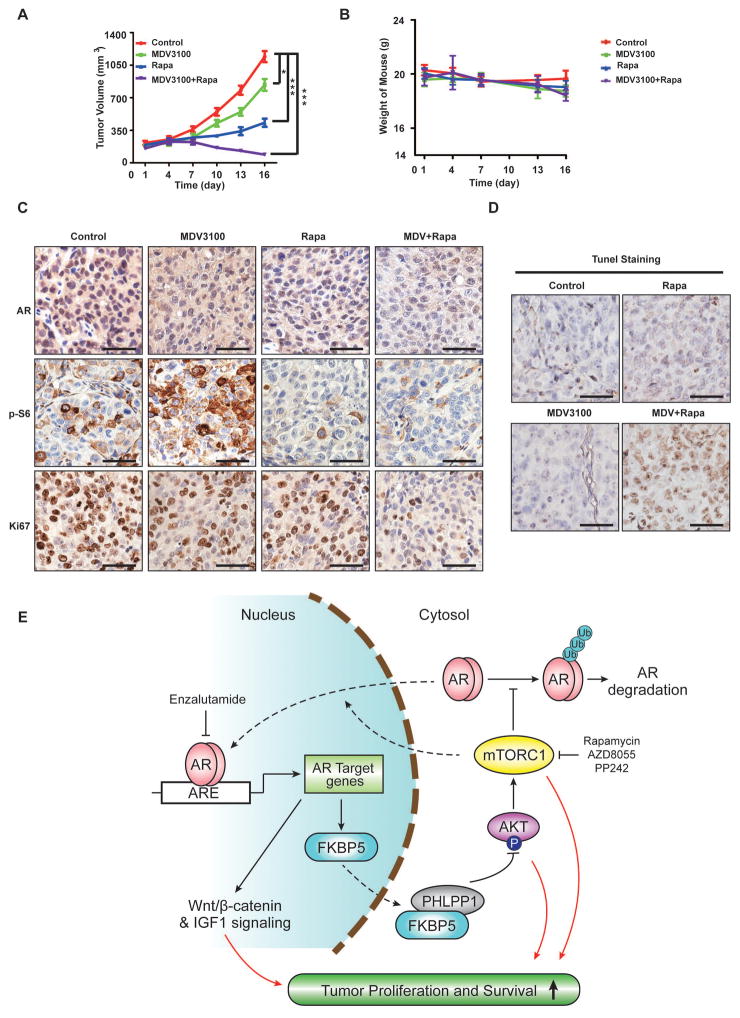
Hepatocellular carcinoma (HCC) is a male-dominant cancer, and androgen receptor (AR) has been linked to the pathogenesis of HCC. However, AR expression and its precise role in HCC remain controversial. Moreover, previous antiandrogen and anti-AR clinical trials in HCC failed to demonstrate clinical benefits. In this study, we found that AR is overexpressed in the nucleus of approximately 37% of HCC tumors, which is significantly associated with advanced disease stage and poor survival. AR overexpression in HCC cells markedly alters AR-dependent transcriptome, stimulates oncogenic growth, and determines therapeutic response to enzalutamide, a second generation of AR antagonist. However, AR inhibition evokes feedback activation of AKT-mTOR (mechanistic target of rapamycin) signaling, a central regulator for cell growth and survival. On the other hand, mTOR promotes nuclear AR protein expression by restraining ubiquitin-dependent AR degradation and enhancing AR nuclear localization, providing a mechanistic explanation for nuclear AR overexpression in HCC. Finally, cotargeting AR and mTOR shows significant synergistic anti-HCC activity and decreases tumor burden by inducing apoptosis in vivo.

Conclusion: Nuclear AR overexpression is associated with the progression and prognosis of HCC. However, enzalutamide alone has limited therapeutic utility attributed to feedback activation of the AKT-mTOR pathway. Moreover, mTOR drives nuclear AR overexpression. Cotargeting AR and mTOR is a promising therapeutic strategy for HCC. (Hepatology 2018;67:2271-2286).


Conflict of interest statement

Competing Interests: None declared.

Figures

Fig. 1
Fig. 1. Nuclear AR is overexpressed in HCC, which is associated with tumor progression and poor prognosis
(A) AR mRNA is overexpressed in a subset of HCC. AR mRNA expression data is downloaded from an OncoMine microarray dataset that includes 104 HCC and 76 normal liver tissues. The results were analyzed by student’s t-test (bar represents mean value). (B) Representative AR immunohistochemistry (IHC) staining in primary HCC and adjacent noncancerous liver tissues (scale bar 50 μm). (C) Scatter plots of nuclear AR IHC scores in HCC and adjacent noncancerous liver tissues. Bar represents mean value (N = 142, paired t-test). The lower panel shows the ratio of nuclear AR in paired tumor/adjacent noncancerous tissues. (D) Scatter plot of cytoplasmic AR IHC scores in HCC and adjacent noncancerous liver tissues. Bar represents mean value (N = 142, sample-paired t-test). The lower panel shows the ratio of cytoplasmic AR in paired tumor/adjacent noncancerous tissues. (E) Kaplan-Meier analysis of overall survival in patients with high and low nuclear AR expression.
Fig. 2
Fig. 2. AR overexpression promotes AR-dependent transcriptome in HCC cells
(A) AR protein expression in a panel of immortalized liver and HCC cell lines as determined by immunoblot. GAPDH serves as a loading control (top panel). (B) AR is predominantly localized in the nucleus of SNU423 and MHCC-97L cells. Shown is immunofluorescent (IF) staining of AR in SNU423 and MHCC-97L cells. The nuclei were counterstained by DAPI. Scar bar, 50 μm. (C) Luciferase reporter driven by androgen response element (ARE) was measured in the presence or absence of testosterone for 24 h in SNU423 and MHCC-97L cell lines. Data (mean ± SD, n = 3) were analyzed by unpaired two-tail t test; *** p < 0.001. (D) AR overexpression significantly alters AR-dependent transcriptome in HCC cells. SNU449 cells were infected with a lentiviral AR-Flag or a control lentivirus, and analyzed for the expression of key AR target genes using the Human Androgen Receptor Signaling Targets PCR Array. Left panel shows a heat map of key AR target genes in control and AR overexpressing cells. Right panel shows biological pathways enrichment in differentially expressed key AR target genes. Data were analyzed using the Database for Annotation, Visualization and Integrated Discovery (DAVID). (E) Scatter plot identifies differentially expressed AR target genes due to AR overexpression. Red and green dots indicate with significantly increased or decreased AR target genes, respectively, in AR overexpressing cells versus control cells. (F) qRT-PCR analysis of eight randomly selected AR target genes to verify results from the Human Androgen Receptor Signaling Targets Array. GAPDH was used as an internal control. Data (mean ± SD, n = 3) were analyzed by Student’s T test; * p < 0.05.
Fig. 3
Fig. 3. AR overexpression renders AR-dependent growth and enzalutamide sensitivity in HCC cells
(A) SNU423, MHCC97L, SNU449, PLC5 and LO2 cells were treated with different concentrations of enzalutamide (MDV3100) treatment for 4 days. Shown is the dose response curve. Data represent mean ± SD (n = 4). (B) Correlation analysis of AR expression and enzalutamide (MDV3100) IC50 for SNU423, MHCC97L, SNU449, PLC5 and LO2 cells. Correlation was evaluated by a nonparametric Spearman test. The number of cell lines (n), coefficient of correlation (r), and p value (p) are as indicated. (C) Enzalutamide attenuates testosterone-stimulated growth of AR-positive HCC cells. SNU423 and MHCC97L cells were treated with testosterone in the presence or absence of enzalutamide (MDV3100) for 5 days. Cell growth was measured daily by the CCK8 assay. Data were analyzed by Repeated measures ANOVA (mean ± SD, n = 4, * p < 0.05). (D) AR knockdown inhibits testosterone-stimulated growth of SNU423 and MHCC97L cells. SNU423 and MHCC-97L cells were transfected with AR-specific siRNA (siAR) or a control siRNA (siCtrl) in the presence of testosterone. Cell growth was measured by CCK8 assay. Data were analyzed by Repeated measures ANOVA (mean ± SD, n = 4, * p < 0.05). (E) AR knockdown expression has little effect on the growth of LO2 and Huh7 cells. LO2 and Huh7 cells were transfected with siAR or siCtrl in the presence of testosterone. Cell growth was measured by CCK8 assay. Data were analyzed by Repeated measures ANOVA (mean ± SD, n = 4, * ns, not significant).
Fig. 4
Fig. 4. Inhibition of AR leads to feedback activation of AKT-mTOR signaling through FKBP5 in HCC cells
(A) AR knockdown leads to activation of AKT-mTOR signaling in high AR-expressing cells. AR is knocked down in SNU423 and MHCC-97L cells. The effect on AKT-mTOR signaling was examined by immunoblot analysis of phosphorylation of AKT, mTOR and S6K. GAPDH was used as a loading control. Lower panels, quantification of the results (Mean ± SD, ** p < 0.01). (B) Enzalutamide treatment leads to activation of AKT-mTOR signaling in high AR-expressing cells. SNU423 and MHCC-97L cells were treated with enzalutamide (MDV3100) for different times and examined for PI3K-AKT-mTOR signaling by immunoblot. (C) Enzalutamide inhibits the expression of FKBP5 mRNA. SNU423 cell was treated with enzalutamide (MDV3100) for 48 h. The expression of FKBP5 was analyzed by qRT-PCR. Data represent mean ± SD in triplicates and were analyzed using Student T-test, *** p < 0.001. (D) AR inhibition leads to down-regulation of FKBP5 and PHLPP1 proteins in high AR-expressing cells, not low AR-expressing cells. SNU423, MHCC-97L and SNU449 cells were treated with enzalutamide (MDV3100) for 48 h. The effect on mTOR signaling, and the expression of FKBP5 and PHLPP1 was analyzed by immunoblot. GAPDH was used as a loading control. (E) AR overexpression promotes FKBP5 expression and attenuates AKT-mTOR signaling. AR was transiently overexpressed in SNU449 and PLC5 cells. The effect on mTOR signaling and the expression of FKBP5 and PHLPP1 was analyzed by immunoblot.
Fig. 5
Fig. 5. mTOR promotes AR transcriptional activity by enhancing AR stability and nuclear localization
(A) Rapamycin suppresses AR transcriptional activity in HCC. The activity of ARE luciferase reporter was assayed in the absence or presence of rapamycin without or with testosterone for 24 h in SNU423 and MHCC9-7L cells. Luciferase activity is expressed relative to the Renilla control. Data (mean ± SD, n = 3) were analyzed by Student’s T test; *** p < 0.001. (B) Rapamycin decreases AR protein level. SNU423 cells were treated with rapamycin for different times and measured for AR protein by immunoblot. Numbers represent relative quantification of AR protein (representative of three independent experiments, arbitrary unit). (C) AR protein level is regulated by growth factors, not amino acids. SNU423 cells were starved from serum or amino acids for 24 h and analyzed for AR protein level by immunoblot. (D) Rapamycin accelerates AR protein turnover. SNU423 and MHCC-97L cells were treated with or without rapamycin in the presence of cycloheximide (CHX). The ratio of AR/GAPDH is used to calculate AR stability. Lower panel shows quantification of the results. Data (mean ± SD, n = 4) were analyzed by Student’s T test; *p < 0.05. (E) Rapamycin induces proteasome-dependent AR degradation. SNU423 and MHCC-97L cells were treated without or with rapamycin in the presence of the proteasome inhibitor MG132. The numbers show the relative AR protein amount representative of three independent experiments. (F) Rapamycin inhibits AR nuclear localization in HCC cells. SNU423 and MHCC-97L cells were treated without or with rapamycin for 24 h. AR localization was analyzed by IF and the nuclei were counterstained by DAPI. Scar bar 10 μm. Normal, normal exposure; Enhanced, images were enhanced to show details.
Fig. 6
Fig. 6. Co-targeting AR and mTOR improves anti-HCC activity in vitro
(A) Enzalutamide and rapamycin inhibit HCC cell proliferation. SNU423 and MHCC-97L cells were treated with drug carrier (DMSO), enzalutamide (MDV3100), rapamycin, or the combination of two drugs for different times, and measured for cell proliferation by the CCK8. Data (mean ± SD, n = 4) were analyzed by Repeated measures ANOVA; *** p < 0.001. (B) Enzalutamide and rapamycin inhibit oncogenic growth of HCC cells. Foci formation assay was performed with SNU423 and MHCC-97L cells treated with DMSO, enzalutamide (MDV3100), rapamycin, or their combination. (C) Quantification of the above results. Data (mean ± SD, n = 4) were analyzed by Repeated measures ANOVA; ***p < 0.001. (D) Same as Fig. 6A except AR siRNA was used. Data (mean ± SD, n = 4) were analyzed by Repeated measures ANOVA; *** p < 0.001. (E) Enzalutamide and AZD8055 display strong anti-HCC activity. SNU423 and MHCC-97L cells were treated with DMSO, enzalutamide (MDV3100), AZD8055, or the combination of two drugs for different times, and measured for cell proliferation by the CCK8. Data (mean ± SD, n = 4) were analyzed by Repeated measures ANOVA; *** p < 0.001. (F) Same as Fig. 6E except PP242 was used. Data (mean ± SD, n = 4) were analyzed by Repeated measures ANOVA; *** p < 0.001.
Fig. 7
Fig. 7. Co-targeting AR and mTOR produces robust anti-HCC activity in vivo
(A) Combination of enzalutamide and rapamycin significantly reduces HCC tumor burden. Mice bearing MHCC-97L xenograft tumors were treated with a drug carrier, enzalutamide (MDV3100), rapamycin or their combination. Tumor volume was measured at different times. Data (mean ± SD, n = 10) were analyzed by Repeated measures ANOVA; *** p < 0.001. (B) Targeting AR and mTOR is well tolerated in mice. Mouse weight was measured every 3 day in the above experiment. Data (mean ± SD, n = 10) were analyzed by Student’s T test; *** p < 0.001. (C) Xenograft tumors from the above experiment were analyzed for AR, p-S6 and Ki67 by IHC staining. Shown are representative IHC stained tumor sections. Scar bar, 50 μm. (D) Co-targeting AR and mTOR triggers strong apoptotic cell death in HCC tumors. HCC xenograft tumors in different treatment groups were examined for apoptotic cell death by TUNEL staining. Scar bar, 50 μm. Right panel shows quantification of the TUNEL staining. Data (mean ± SD, n = 5) were analyzed by Student’s T test; *** p < 0.001. (E) A working model shows the crosstalk between mTOR and AR pathways in the pathogenesis and therapy of HCC.

References

    1. Marquardt JU, Thorgeirsson SS. SnapShot: Hepatocellular carcinoma. Cancer Cell. 2014;25:550, e551. - PubMed
    1. Forner A, Llovet JM, Bruix J. Hepatocellular carcinoma. Lancet. 2012;379:1245–1255. - PubMed
    1. Torre LA, Bray F, Siegel RL, Ferlay J, Lortet-Tieulent J, Jemal A. Global cancer statistics, 2012. CA Cancer J Clin. 2015;65:87–108. - PubMed
    1. Starley BQ, Calcagno CJ, Harrison SA. Nonalcoholic fatty liver disease and hepatocellular carcinoma: a weighty connection. Hepatology. 2010;51:1820–1832. - PubMed
    1. Mokdad AH, Dwyer-Lindgren L, Fitzmaurice C, et al. Trends and patterns of disparities in cancer mortality among us counties, 1980–2014. JAMA. 2017;317:388–406. - PMC - PubMed

Publication types

MeSH terms