. 2017 Dec 7;68(5):970-977.e11.
doi: 10.1016/j.molcel.2017.11.023.

Multi-omic Mitoprotease Profiling Defines a Role for Oct1p in Coenzyme Q Production

Affiliations

Multi-omic Mitoprotease Profiling Defines a Role for Oct1p in Coenzyme Q Production

Mike T Veling et al. Mol Cell. .

Abstract

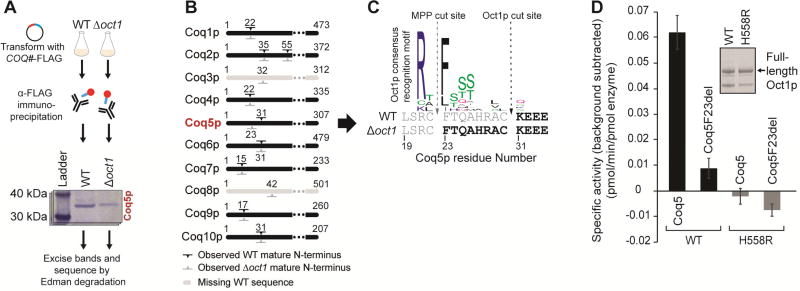
Mitoproteases are becoming recognized as key regulators of diverse mitochondrial functions, although their direct substrates are often difficult to discern. Through multi-omic profiling of diverse Saccharomyces cerevisiae mitoprotease deletion strains, we predicted numerous associations between mitoproteases and distinct mitochondrial processes. These include a strong association between the mitochondrial matrix octapeptidase Oct1p and coenzyme Q (CoQ) biosynthesis-a pathway essential for mitochondrial respiration. Through Edman sequencing and in vitro and in vivo biochemistry, we demonstrated that Oct1p directly processes the N terminus of the CoQ-related methyltransferase, Coq5p, which markedly improves its stability. A single mutation to the Oct1p recognition motif in Coq5p disrupted its processing in vivo, leading to CoQ deficiency and respiratory incompetence. This work defines the Oct1p processing of Coq5p as an essential post-translational event for proper CoQ production. Additionally, our data visualization tool enables efficient exploration of mitoprotease profiles that can serve as the basis for future mechanistic investigations.

Keywords: Coq5p; MIPEP; Oct1p; coenzyme Q; mitochondria; mitoproteases; multi-omic; oligopeptidase; protease; transomic; ubiquinone.


Figures

Figure 1
Figure 1. Overview of mitochondrial protease profiling
(A) Proteins encoded by the individual genes deleted from the 19 yeast strains investigated in this study and their mitochondrial localization. (B) Overview of experimental design and data collected. Shapes indicate protein localization as shown in A. Representative growth curves are shown to indicate the yeast growth stage at time of collection. (C) Hierarchical clusters of Δgene strains in respiration and fermentation conditions across the proteome metabolome, and lipidome. Clustering was based on relative abundances compared to WT for significantly changing proteins as quantified by MS (mean, n = 3, p < 0.05, two-sided Student’s t-test). Strains are clustered based on respiration proteome correlations for all maps. See Table S1 for further information and strain order. (D) Maps of Pearson correlation coefficients (r2) for pairs of Δgene proteomic perturbation profiles across metabolic conditions. Strains are clustered based on respiration proteome correlations, and this strain order is held consistent across the fermentation correlations and in the additional maps in Figure S2.
Figure 2
Figure 2. Mitochondrial protease profiling reveals connections between proteases and diverse biological processes
(A) Volcano plot showing the log2 fold change in protein levels in WT versus Δpim1 yeast (log2pim1/WT]) on the X-axis and significance of the change (p-value) on the Y-axis. p-value was calculated with a 2-sample Student’s t-test. (B) Outlier analysis examining all strains for specific perturbations in Isu1p across Δgene strains. Each point indicates Isu1p abundance in a Δgene strain versus WT. p-value was calculated with a 2-sample Student’s t-test. (C) Same as B for Isa1p across Δgene strains. (D) Bar graph showing levels of CoQ6 across Δgene strains. Error bars indicate ± 1 standard deviation. *Indicates a 2-sample Student’s t-test p-value less than 0.05. (E) Same as B for 4-hydroxybenzoate (4-HB) across Δgene strains. (F) Abbreviated illustration of the S. cerevisiae CoQ6 biosynthetic pathway. Arrows pointing to other panels indicate specific measurements of individual proteins, metabolites, and lipids in this pathway. (G) Same as D for 3-hexaprenyl-4-hydroxybenzoate (HHB) levels across Δgene strains. (H) Same as B for Coq5p protein abundance across Δgene strains.
Figure 3
Figure 3. Coq5p is an Oct1p substrate
(A) Overview of process for preparing samples for Edman degradation. See STAR Methods for more details. (B) Overview of N-termini observed for Coq1-10p. Marks indicate the N-terminus observed from WT (black) and Δoct1 yeast (gray). Only the N-termini for Coq5p differ between strains. See Table S4 for all Edman results. (C) Sequence level view of Edman results for Coq5p. Residues shown in grey were not observed in the indicated strain. Sequence logo is derived from the list of known Oct1p substrates described in Vögtle et. al. 2011. (D) Activity of WT or catalytically dead (H558R) Oct1p against fluorescent peptides (see STAR Methods for data acquisition and processing). Error bars indicate ± 1 standard deviation.
Figure 4
Figure 4. Oct1p processing stabilizes Coq5p and is essential for enabling proper CoQ6 production
(A) Confocal images of WT and F23A Coq5p–FLAG (red in merge) compared with citrate synthase (Cit1p) localization (green in merge) and DNA staining with DAPI (blue in merge). Scale bars at 1 µm. (B) Quantitative Western blot of WT Coq5p–FLAG expressed in WT yeast (lane 1), F23A Coq5p–FLAG expressed in WT yeast (lane 2), and WT Coq5p–FLAG expressed in Δoct1 yeast (lane 3). Upper set of bands indicates Coq5p detected by an anti-FLAG Western. Lower set is an actin loading control. Lower bar graph shows relative abundance of Coq5p versus actin quantified in biological triplicate. Error bars indicate ± 1 standard deviation. (C) Growth curves of Δcoq5 yeast rescued with indicated vector construct. (D) Targeted lipidomics measurements of CoQ-related lipids. Log2 fold change was calculated as a proportion of the WT rescue versus the mutant or empty vector rescue as shown in C. See STAR Methods for calculation details. Error bars indicate ± 1 standard deviation. (E) Western blot measuring endogenous Coq5p versus a loading control (VDAC) over time after cycloheximide treatment. (F) Quantification of Western blots shown in E. Amount remaining was calculated as a ratio of Coq5p to VDAC normalized to T0 (see STAR methods). Error bars indicate ± 1 standard deviation.

References

    1. Anand R, Wai T, Baker MJ, Kladt N, Schauss AC, Rugarli E, Langer T. The i-AAA protease YME1L and OMA1 cleave OPA1 to balance mitochondrial fusion and fission. J Cell Biol. 2014;204:919–929. - PMC - PubMed
    1. Ashby MN, Kutsunai SY, Ackerman S, Tzagoloff A, Edwards PA. COQ2 is a candidate for the structural gene encoding para-hydroxybenzoate:polyprenyltransferase. J Biol Chem. 1992;267:4128–4136. - PubMed
    1. Avci D, Fuchs S, Schrul B, Fukumori A, Breker M, Frumkin I, Chen CY, Biniossek ML, Kremmer E, Schilling O, et al. The yeast ER-intramembrane protease Ypf1 refines nutrient sensing by regulating transporter abundance. Mol Cell. 2014;56:630–640. - PubMed
    1. Bender T, Pena G, Martinou JC. Regulation of mitochondrial pyruvate uptake by alternative pyruvate carrier complexes. EMBO J. 2015;34:911–924. - PMC - PubMed
    1. Blommel PG, Martin PA, Seder KD, Wrobel RL, Fox BG. Flexi vector cloning. Methods Mol Biol. 2009;498:55–73. - PMC - PubMed

MeSH terms

LinkOut - more resources