. 2017 Dec 7;101(6):939-964.
doi: 10.1016/j.ajhg.2017.11.001.

A Powerful Approach to Estimating Annotation-Stratified Genetic Covariance via GWAS Summary Statistics

Affiliations

A Powerful Approach to Estimating Annotation-Stratified Genetic Covariance via GWAS Summary Statistics

Qiongshi Lu et al. Am J Hum Genet. .

Abstract

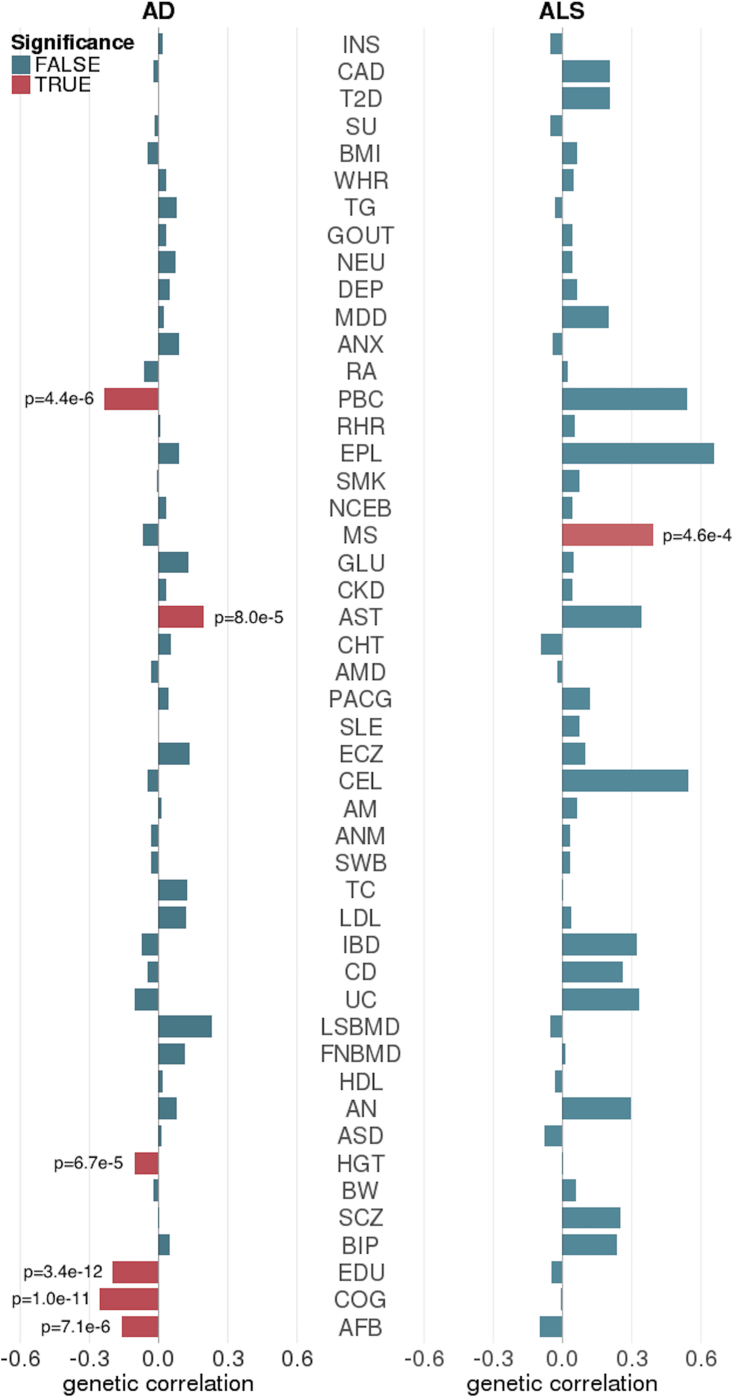
Despite the success of large-scale genome-wide association studies (GWASs) on complex traits, our understanding of their genetic architecture is far from complete. Jointly modeling multiple traits' genetic profiles has provided insights into the shared genetic basis of many complex traits. However, large-scale inference sets a high bar for both statistical power and biological interpretability. Here we introduce a principled framework to estimate annotation-stratified genetic covariance between traits using GWAS summary statistics. Through theoretical and numerical analyses, we demonstrate that our method provides accurate covariance estimates, thereby enabling researchers to dissect both the shared and distinct genetic architecture across traits to better understand their etiologies. Among 50 complex traits with publicly accessible GWAS summary statistics (Ntotal≈ 4.5 million), we identified more than 170 pairs with statistically significant genetic covariance. In particular, we found strong genetic covariance between late-onset Alzheimer disease (LOAD) and amyotrophic lateral sclerosis (ALS), two major neurodegenerative diseases, in single-nucleotide polymorphisms (SNPs) with high minor allele frequencies and in SNPs located in the predicted functional genome. Joint analysis of LOAD, ALS, and other traits highlights LOAD's correlation with cognitive traits and hints at an autoimmune component for ALS.

Keywords: Alzheimer’s disease; amyotrophic lateral sclerosis; functional annotation; genetic covariance; genome-wide association study; summary statistics.


Figures

Figure 1
Figure 1
Evaluation of Covariance Estimation and Statistical Power through Simulations Detailed simulation settings are described in the Material and Methods. (A–D) Compare GNOVA and LDSC using traits simulated from a non-stratified covariance structure. We first fixed heritability for both traits but set genetic correlation to different values. The covariance estimates are shown in (A). (B) shows the statistical power. Next, we fixed genetic correlation but chose different values for heritability and covariance. Covariance estimates and statistical power are shown in (C) and (D), respectively. (E–H) Estimate annotation-stratified genetic covariance. In (E) and (F), we simulated data using two non-overlapping functional annotations. Results in (G) and (H) are based on two overlapping annotations. The true covariance values are labeled under each setting. Type I error was not inflated when the true covariance was zero.
Figure 2
Figure 2
Comparison of Genetic Correlations Estimated via GNOVA and LDSC Each point represents a pair of traits. Overall, genetic correlation estimates are concordant between GNOVA and LDSC, but GNOVA is more powerful when genetic correlation is moderate. Color and shape of each data point represent the significance status given by GNOVA and LDSC. Trait pairs that involve gout were removed from this figure because LDSC estimated its heritability to be negative and could not properly output p values.
Figure 3
Figure 3
Estimated Genetic Correlations of 435 Pairs of Traits from 30 GWASs To visualize a large number of pairwise correlations more efficiently, we excluded closely related traits and studies with smaller sample sizes (N < 30,000) in this figure. Asterisks highlight significant genetic correlations after Bonferroni correction for all 1,128 pairs (p < 4.4 × 10−5). The complete heatmap matrix is presented in Figure S3. The order of traits was determined by hierarchical clustering.
Figure 4
Figure 4
Annotation-Stratified Covariance Analysis (A) Stratify genetic covariance by genome functionality predicted by GenoCanyon. Total genetic covariance estimates were highly concordant between stratified and non-stratified models. (B) For significantly correlated pairs of traits based on the non-stratified model, we compared genetic covariance in the functional and the non-functional genome. Solid line marks the expected value based on annotation’s size. Trait pair LDL-TC is also plotted. (C) Stratify genetic covariance by MAF quartile. We compared the genetic covariance estimated by MAF-stratified and non-stratified models. (D) Six pairs of traits that are uniquely correlated in the lowest MAF quartile. Intervals show the standard error of covariance estimates. Asterisks indicate p values below 4.4 × 10−5. (E) Stratify genetic covariance by tissue type. Each bar denotes the log-transformed p value. Dashed line highlights the Bonferroni-corrected significance level 0.05/(7 × 1128) = 6.3 × 10−6.
Figure 5
Figure 5
Stratification of Genetic Covariance between LOAD and ALS by Chromosome (A) Comparisons of the estimated per-chromosome genetic covariance with chromosome size. (B) Comparisons of the estimated genetic covariance in the predicted functional genome on each chromosome with size of the functional genome.
Figure 6
Figure 6
Genetic Correlations between LOAD, ALS, and 48 Complex Traits Significant pairs with p < 0.05/(48 × 2) = 5.2 × 10−4 are highlighted in red.

References

    1. Yang J., Benyamin B., McEvoy B.P., Gordon S., Henders A.K., Nyholt D.R., Madden P.A., Heath A.C., Martin N.G., Montgomery G.W. Common SNPs explain a large proportion of the heritability for human height. Nat. Genet. 2010;42:565–569. - PMC - PubMed
    1. Yang J., Lee S.H., Goddard M.E., Visscher P.M. GCTA: a tool for genome-wide complex trait analysis. Am. J. Hum. Genet. 2011;88:76–82. - PMC - PubMed
    1. Yang J., Manolio T.A., Pasquale L.R., Boerwinkle E., Caporaso N., Cunningham J.M., de Andrade M., Feenstra B., Feingold E., Hayes M.G. Genome partitioning of genetic variation for complex traits using common SNPs. Nat. Genet. 2011;43:519–525. - PMC - PubMed
    1. Lee S.H., Yang J., Goddard M.E., Visscher P.M., Wray N.R. Estimation of pleiotropy between complex diseases using single-nucleotide polymorphism-derived genomic relationships and restricted maximum likelihood. Bioinformatics. 2012;28:2540–2542. - PMC - PubMed
    1. Vattikuti S., Guo J., Chow C.C. Heritability and genetic correlations explained by common SNPs for metabolic syndrome traits. PLoS Genet. 2012;8:e1002637. - PMC - PubMed

MeSH terms