. 2018 May:15:74-85.
doi: 10.1016/j.redox.2017.11.009. Epub 2017 Nov 20.

Metabolism of hydrogen sulfide (H2S) and Production of Reactive Sulfur Species (RSS) by superoxide dismutase

Affiliations

Metabolism of hydrogen sulfide (H2S) and Production of Reactive Sulfur Species (RSS) by superoxide dismutase

Kenneth R Olson et al. Redox Biol. 2018 May.

Abstract

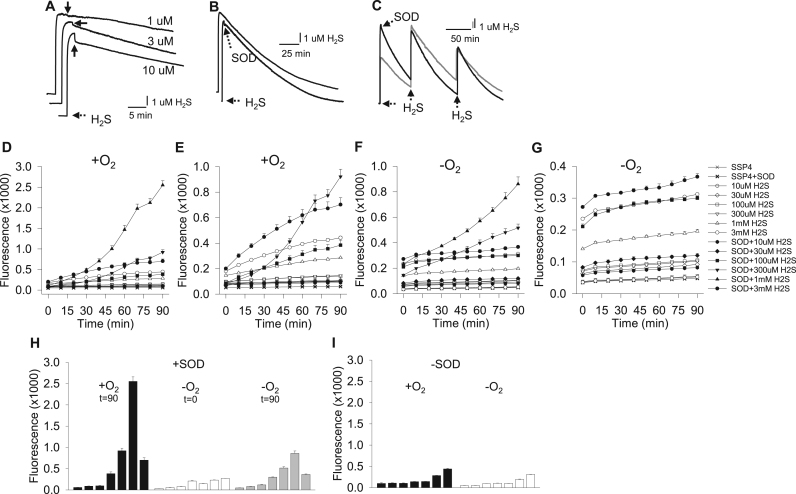
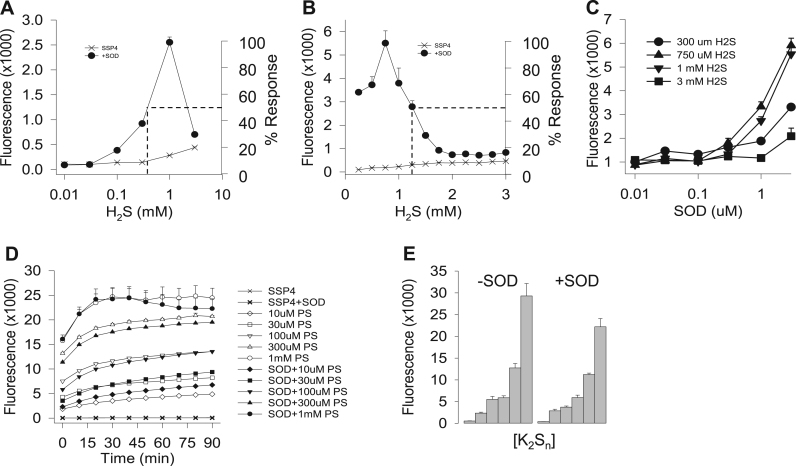
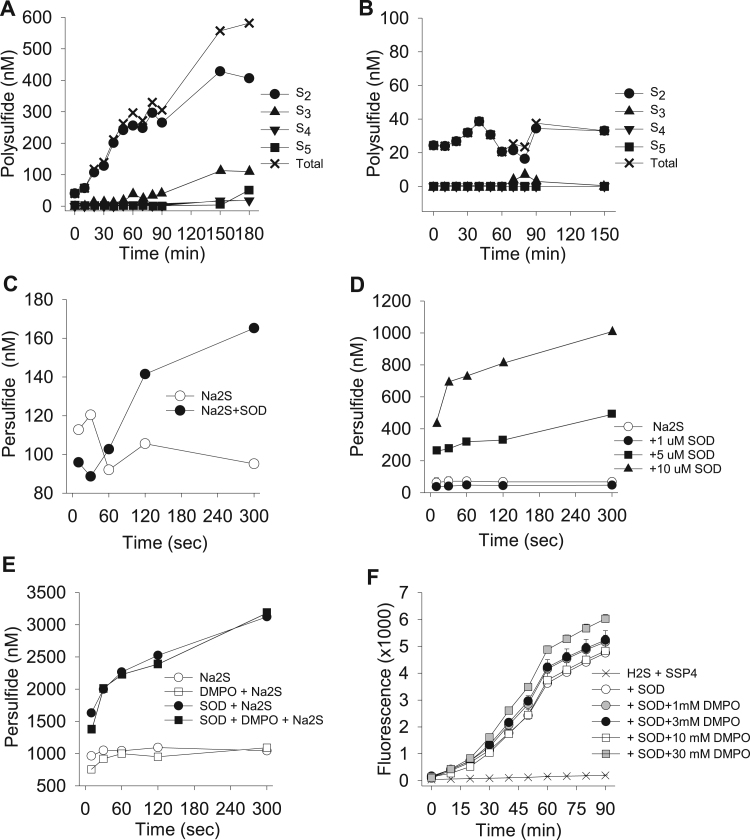
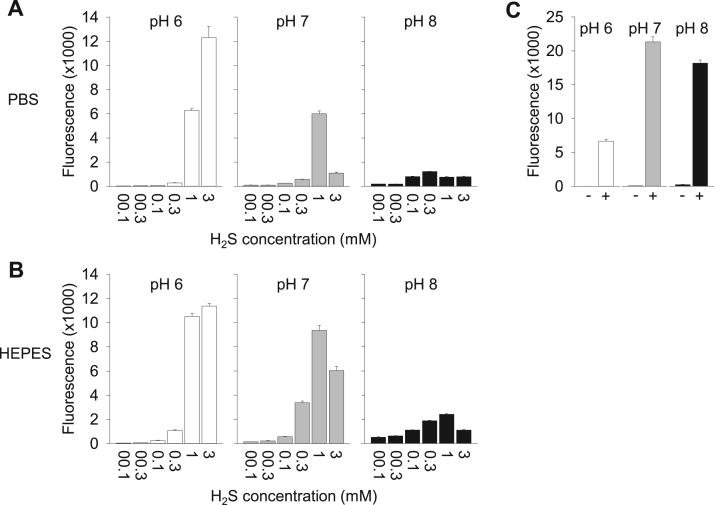
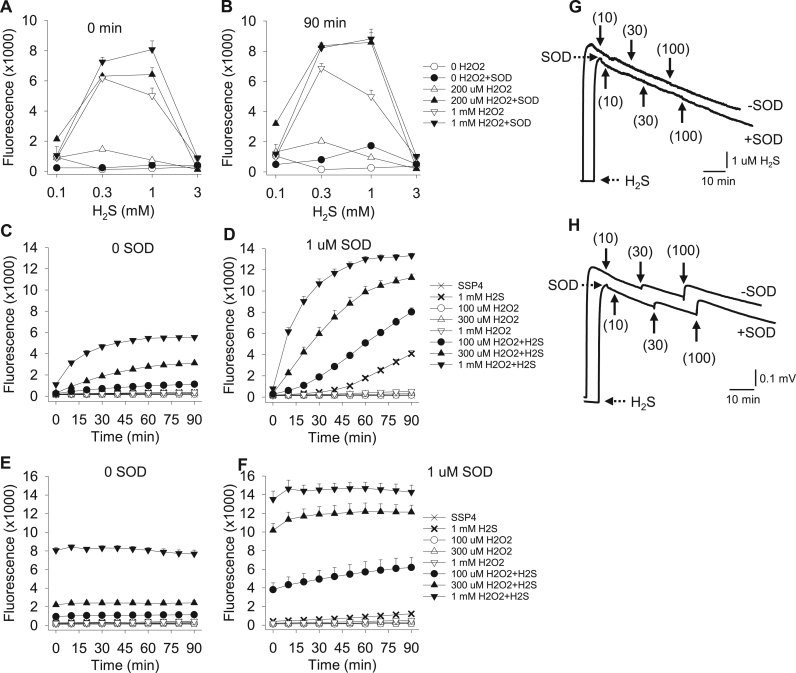
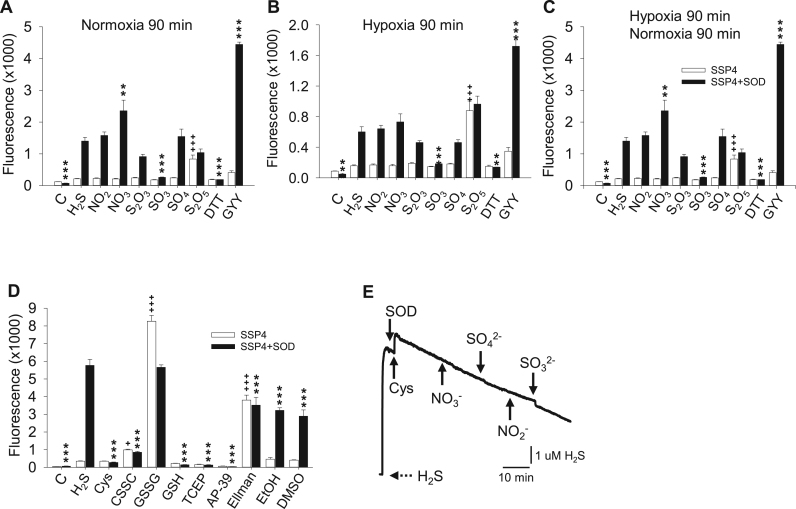
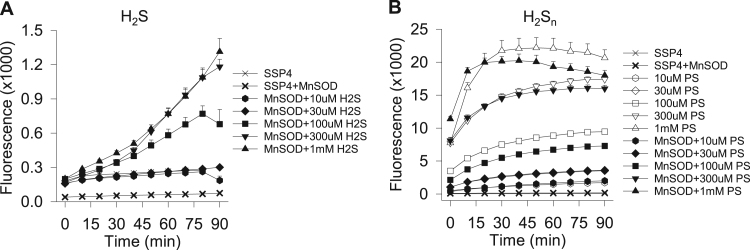
Reactive sulfur species (RSS) such as H2S, HS, H2Sn, (n = 2-7) and HS2•- are chemically similar to H2O and the reactive oxygen species (ROS) HO, H2O2, O2•- and act on common biological effectors. RSS were present in evolution long before ROS, and because both are metabolized by catalase it has been suggested that "antioxidant" enzymes originally evolved to regulate RSS and may continue to do so today. Here we examined RSS metabolism by Cu/Zn superoxide dismutase (SOD) using amperometric electrodes for dissolved H2S, a polysulfide-specific fluorescent probe (SSP4), and mass spectrometry to identify specific polysulfides (H2S2-H2S5). H2S was concentration- and oxygen-dependently oxidized by 1μM SOD to polysulfides (mainly H2S2, and to a lesser extent H2S3 and H2S5) with an EC50 of approximately 380μM H2S. H2S concentrations > 750μM inhibited SOD oxidation (IC50 = 1.25mM) with complete inhibition when H2S > 1.75mM. Polysulfides were not metabolized by SOD. SOD oxidation preferred dissolved H2S over hydrosulfide anion (HS-), whereas HS- inhibited polysulfide production. In hypoxia, other possible electron donors such as nitrate, nitrite, sulfite, sulfate, thiosulfate and metabisulfite were ineffective. Manganese SOD also catalyzed H2S oxidation to form polysulfides, but did not metabolize polysulfides indicating common attributes of these SODs. These experiments suggest that, unlike the well-known SOD-mediated dismutation of two O2•- to form H2O2 and O2, SOD catalyzes a reaction using H2S and O2 to form persulfide. These can then combine in various ways to form polysulfides and sulfur oxides. It is also possible that H2S (or polysulfides) interact/react with SOD cysteines to affect catalytic activity or to directly contribute to sulfide metabolism. Our studies suggest that H2S metabolism by SOD may have been an ancient mechanism to detoxify sulfide or to regulate RSS and along with catalase may continue to do so in contemporary organisms.

Keywords: Antioxidants; Hydrogen peroxide; Oxidants; Reactive Species Interactome; Reactive oxygen species; Redox; Superoxide.


Figures

Fig. 1
Fig. 1
Amperometric traces of H2S metabolism (A-C) and fluorometric measurement of polysulfide production (SSP4 fluorescence) from SOD metabolism of H2S (D-I). (A) Traces showing the effects of increasing SOD concentration on 10 μM H2S. Addition of SOD (arrows) produces a rapid drop in H2S that becomes more pronounced at higher SOD concentrations. (B) Decrease in 10 μM H2S with or without 3 μM SOD for 150 min (C) H2S decreases faster after three consecutive 10 μM H2S injections with SOD (black line) than without SOD (gray line). Decrease in H2S without SOD in (A-C) likely due to inherent volatility, H2S consumption by sensor and possible unidentified reaction(s) in chamber. (D, E) polysulfide (SSP4 fluorescence) formation in normoxia from H2S in the absence (open symbols) or presence (solid symbols) of 1 μM SOD (D, full scale, E, expanded scale with 300 μM and 1 mM H2S omitted). (F, G) polysulfide formation in hypoxia (G, expanded scale with 300 μM and 1 mM H2S omitted). Time 0 min represents sample incubation in 100% N2 for 90 min prior to analysis (equivalent to 90 min in normoxia in D and E). (H) Summary of D and F with SOD after 90 min in normoxia (black bars), 90 min in hypoxia (white bars, t = 0 in plate reader), or 90 min after removal from hypoxia (gray bars). (I) summary of D and F without SOD after 90 min in normoxia (black bars) or hypoxia (white bars). SOD concentration-dependently increased SSP4 fluorescence between 100 μM and 1 mM H2S, whereas at 3 mM H2S fluorescence was inhibited, no inhibition was observed when SOD was absent. Time 0 min samples in normoxia and hypoxia were essentially similar indicating no appreciable polysulfide production after 90 min in hypoxia. All fluorescence values are mean +SE, n = 4 replicates).
Fig. 2
Fig. 2
SOD metabolism of H2S and polysulfides. (A, B) Effects of increasing H2S concentration on polysulfide production (SSP4 fluorescence) after 90 min in normoxia with or without 1 μM SOD (values in A from Fig. 1D). Note: log H2S scale in A and linear, 250 μM H2S increments, in B. Dashed lines indicate approximate EC50 (380 μM H2S, A) and IC50 (1.25 mM H2S, B). (C) SOD concentration-dependently increases polysulfide production. (D) Concentration-dependent SSP4 fluorescence from K2Sn is independent of the absence (open symbols) or presence (solid symbols) of 1 μM SOD in normoxia. (E) After 90 min in hypoxia, SSP4 fluorescence produced by K2Sn alone (-SOD, left panel) is essentially identical to that produced in the presence of 1 μM SOD (+SOD, right panel). All points are mean +SE, n = 4 replicates.
Fig. 3
Fig. 3
Mass spectrometric identification of polysulfides produced by SOD metabolism of Na2S (A-E). (A, B) Production over extended period from 1 mM Na2S under normoxic conditions with (A) or without (B) 1 μM SOD. (A) Persulfide (H2S2) is predominately produced by SOD, whereas other polysulfides appear later. (B) A small amount of persulfide initially appears, likely as a contaminant of Na2S, but no additional polysulfide production is evident (note expanded scale in B). (C-E) short-term (5 min) measurements of persulfide production from 1 mM Na2S. (C) Persulfide is produced from 1 mM Na2S and 1 μM SOD within 2 min and is further increased at 5 min. (D) SOD concentration-dependently increases persulfide production from1 mM Na2S. Note rapid initial rate of persulfide production at elevated SOD concentrations. (E) The radical scavenger DMPO (2 mM) does not affect persulfide production by 10 μM SOD and 1 mM Na2S. (F) Confirmation of the inability of 1–30 mM DMPO to affect polysulfide production (SSP4 fluorescence) by 3 μM SOD metabolism of 750 μM Na2S. A-E, n = 1, F, mean +SE, n = 4.
Fig. 4
Fig. 4
Relative importance of dissolved H2S or HS- anion in SOD oxidation. (A) The effects of increasing H2S concentration on SOD (1 μM) oxidation and formation of polysulfides (SSP4 fluorescence) was determined at pH 6, 7, and 8 in PBS buffer. As pH increased, polysulfide formation decreased and the maximum fluorescence was progressively shifted to lower H2S concentrations. (B) Effects of increasing H2S concentration on SOD (1 μM) oxidation and formation of polysulfides (SSP4 fluorescence) in HEPES buffer are similar to those in PBS. (C) pH-dependence of SSP4 fluorescence with (+) or without (-) 300 μM polysulfides in PBS. Fluorescence of SSP4 plus polysulfides is dramatically decreased at pH 6.0 indicating that polysulfide production from SOD and H2S is underestimated at pH 6.0 and that pH has negligible effect on SSP4 alone. All points are mean +SE, n = 4 replicates.
Fig. 5
Fig. 5
Efficacy of H2O2 as a substrate for SOD metabolism of H2S and polysulfide production (SSP4 fluorescence). (A, B) Comparison of fluorescence produced after 90 min incubation in hypoxia and immediately transferred to plate reader (A; 0 min, i.e., immediately after transfer) versus an additional 90 min in air. Fluorescence did not significantly increase after air exposure indicating that oxidation was completed in hypoxia. C-F) Time-dependent change in fluorescence in normoxia (C, D) or after 90 min in hypoxia and subsequent transfer to normoxia (E, F) without (C, E) or with (D, F) SOD. H2S is effectively oxidized by H2O2 independent of O2 and this is enhanced by SOD. All points are mean +SE, n = 4 replicates. (G-H) Amperometric traces of H2S metabolism. (G) H2S sensor trace showing addition of H2O2 (μM concentration added in parentheses) to 10 μM H2S does not affect the decrease in H2S concentration either with or without 3 μM SOD (+SOD or -SOD, respectively). (H) H2O2 sensor trace showing that addition of H2O2 (concentrations in parentheses) to 10 μM H2S produces a concentration-dependent increase in H2O2 independent of the presence of 3 μM SOD. These traces were recorded simultaneously with those of panel A. Also note the H2O2 sensor is considerably more sensitive to H2S than to H2O2.
Fig. 6
Fig. 6
Effects of possible electron doors and acceptors on polysulfide production (SSP4 fluorescence) from oxidation of H2S with (solid bars) or without (open bars) SOD in normoxia and hypoxia (A-D). SOD (1 μM), H2S (1 mM) and 1 mM sodium salts of nitrite (NO2), nitrate (NO3), thiosulfate (S2O3), sulfite (SO3), sulfate (SO4), metabisulfate (S2O5) and 1 mM dithiothreitol (DTT) and GYY 4137 (GYY), (C control, no H2S A-C) were incubated for 90 min in normoxia (A), 90 in in hypoxia and examined immediately (B) or 90 min hypoxia followed by 90 min normoxia in a covered plate (C). D) 0.75 mM cysteine (Cys), cystine (CSSC), oxidized glutathione (GSSG), glutathione (GSH), the non-sulfur reductant, tris(2-carboxyethyl)phosphine, (TCEP), a mitochondria-targeted H2S donor (AP-39), Ellman's reagent (Ellman), ethanol (EtOH) and dimethyl sulfoxide (DMSO) were incubated in normoxia with 0.75 mM H2S. All points are mean +SE, n = 4 replicates; *, **, and ***, significantly different from 1 mM H2S plus SOD at p < 0.5, 0.01, or 0.001, respectively; +++, significantly different from 1 mM H2S without SOD at p < 0.001). (E) Amperometric trace showing the lack of effect of cysteine (1 mM), nitrite (NO2-; 1 mM), nitrate (NO3-1 mM), sulfite (SO32-; 1 mM) and sulfate (SO42-; 1 mM) on 3 μM SOD metabolism of 10 μM H2S.
Fig. 7
Fig. 7
H2S and polysulfide (H2Sn) metabolism by 1 μM MnSOD. MnSOD produces polysulfides (SSP4 fluorescence) from H2S (A) but does not metabolize polysulfides (B). Mean +SE, n = 4 replicates.

References

    1. Brandes N., Tienson H., Lindemann A., Vitvitsky V., Reichmann D., Banerjee R., Jakob U. Time line of redox events in aging postmitotic cells. Elife. 2013;2:e00306. - PMC - PubMed
    1. Brown D.I., Griendling K.K. Regulation of signal transduction by reactive oxygen species in the cardiovascular system. Circ. Res. 2015;116:531–549. - PMC - PubMed
    1. Chen Y.R., Zweier J.L. Cardiac mitochondria and reactive oxygen species generation. Circ. Res. 2014;114:524–537. - PMC - PubMed
    1. Chouchani E.T., Pell V.R., James A.M., Work L.M., Saeb-Parsy K., Frezza C., Krieg T., Murphy M.P. A unifying mechanism for mitochondrial superoxide production during ischemia-reperfusion injury. Cell Metab. 2016;23:254–263. - PubMed
    1. Circu M.L., Aw T.Y. Reactive oxygen species, cellular redox systems, and apoptosis. Free Radic. Biol. Med. 2010;48:749–762. - PMC - PubMed

Publication types

LinkOut - more resources