. 2017 Sep 8;8(56):95377-95391.
doi: 10.18632/oncotarget.20709. eCollection 2017 Nov 10.

A tRNA fragment, tRF5-Glu, regulates BCAR3 expression and proliferation in ovarian cancer cells

Affiliations

A tRNA fragment, tRF5-Glu, regulates BCAR3 expression and proliferation in ovarian cancer cells

Kun Zhou et al. Oncotarget. .

Abstract

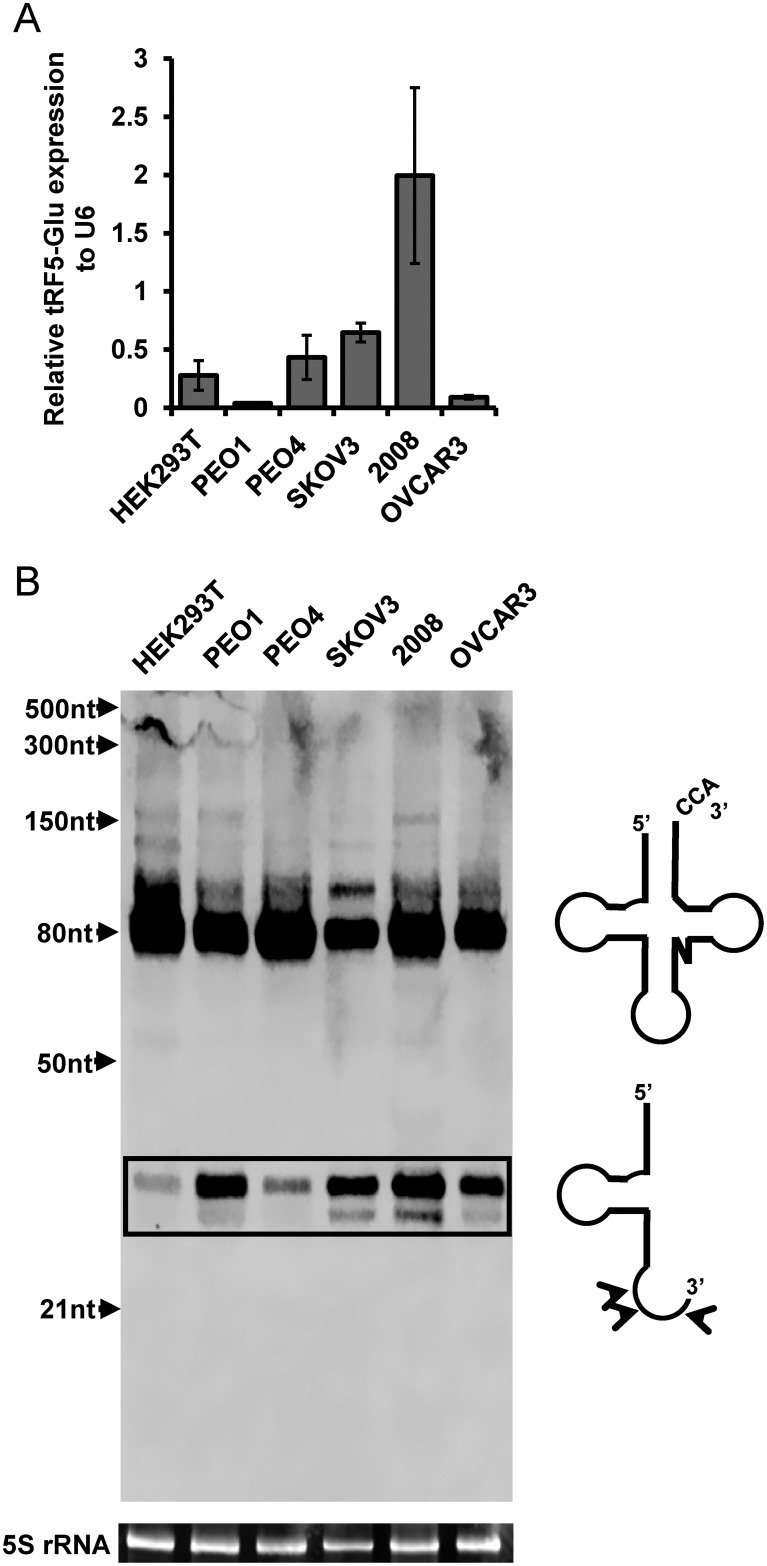
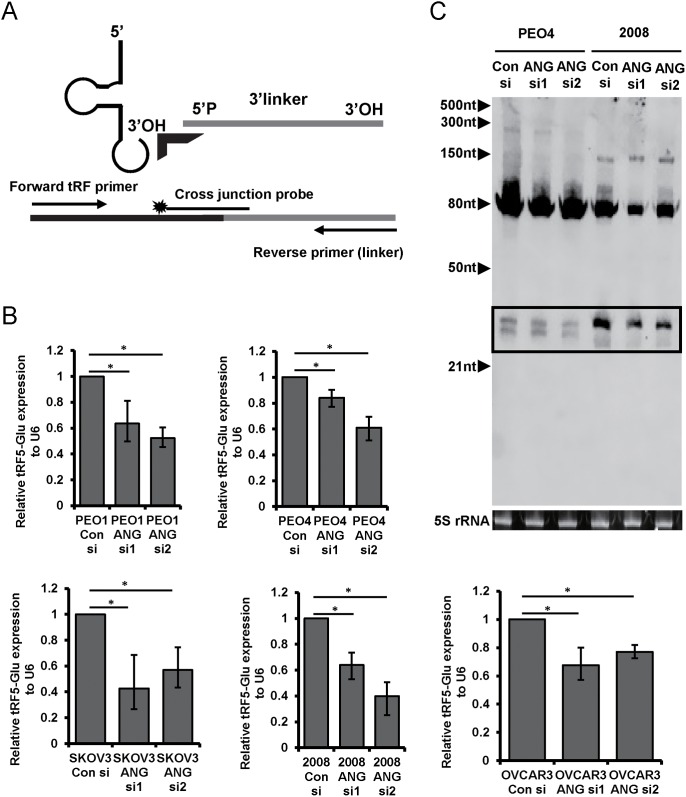
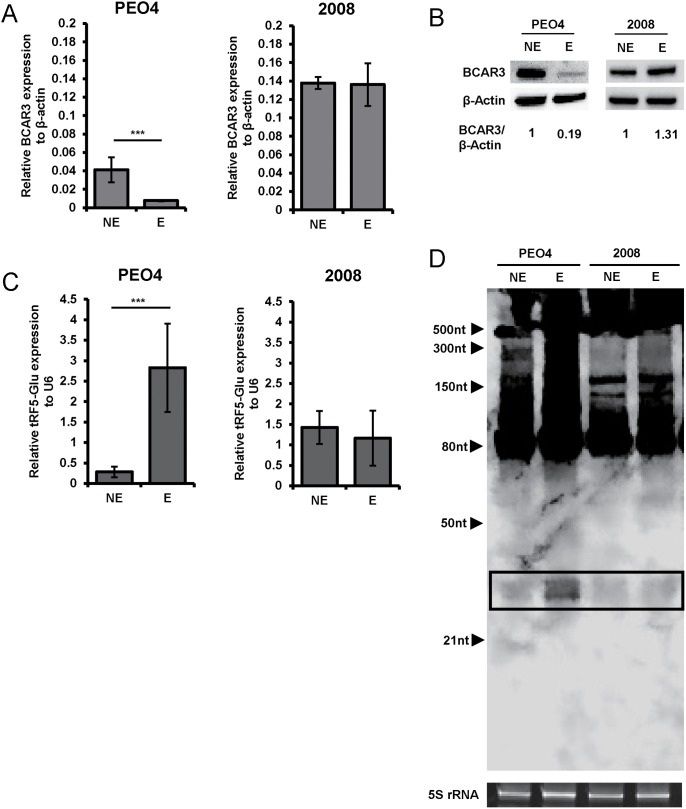
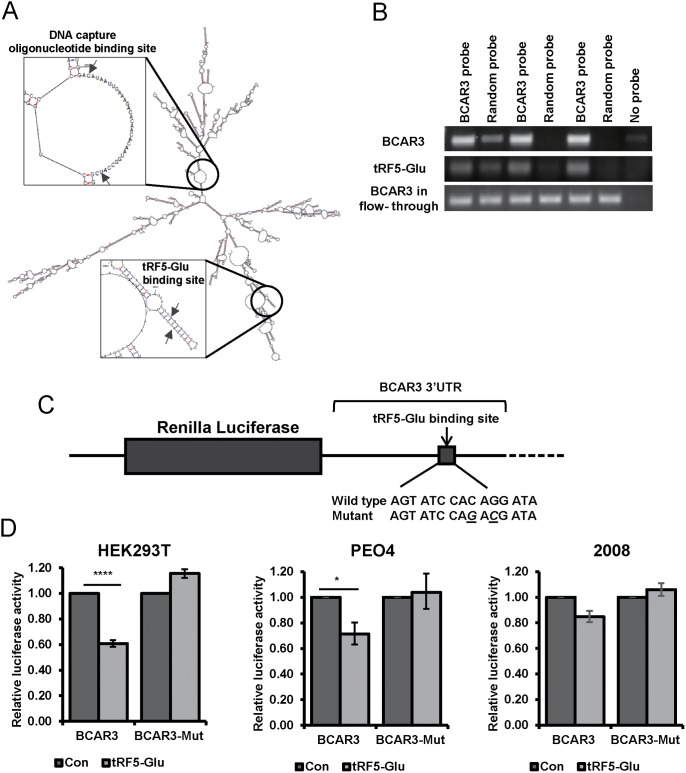
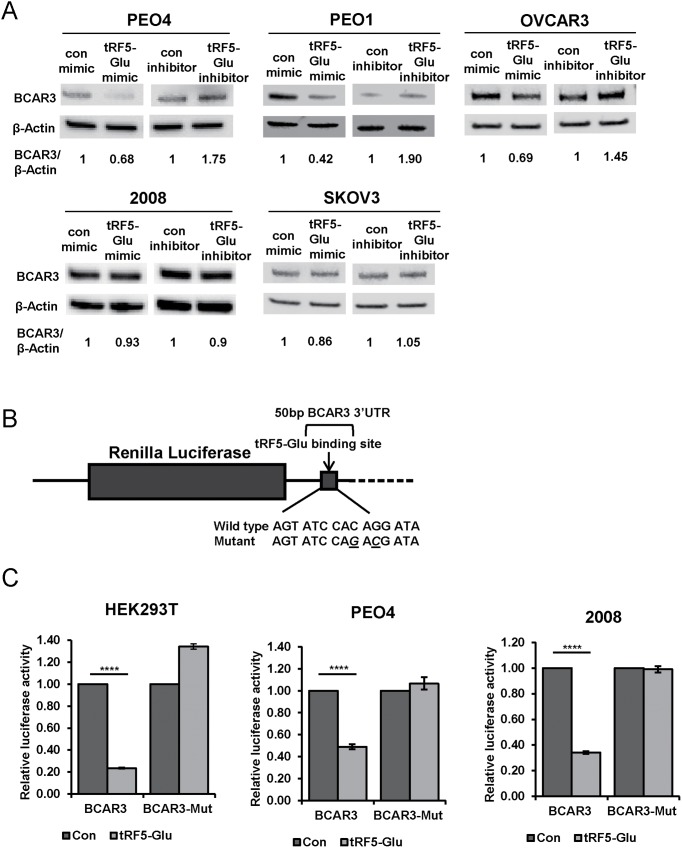
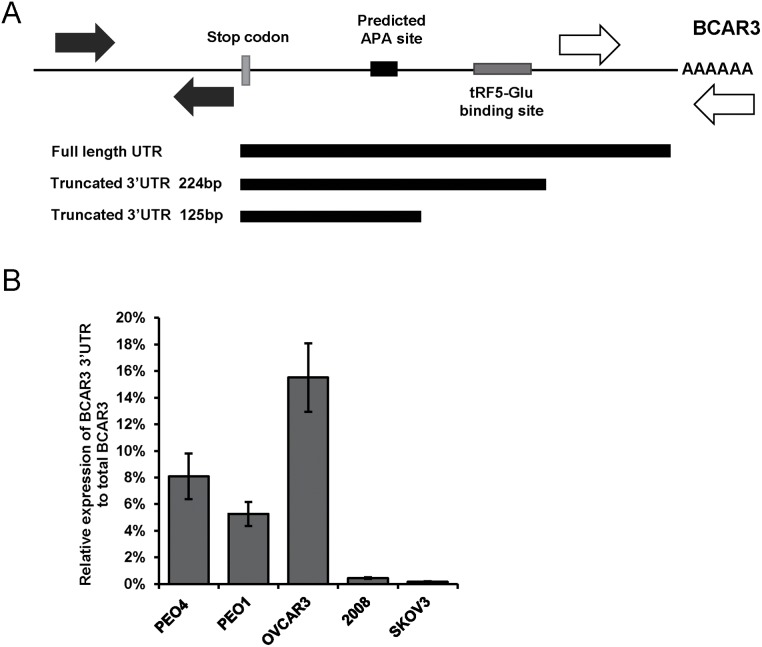
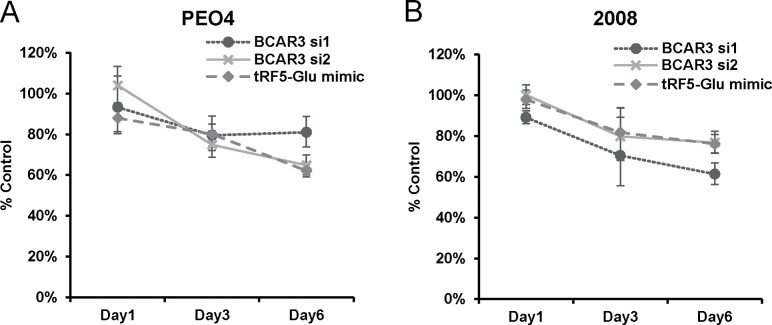
Ovarian cancer is a complex disease marked by tumor heterogeneity, which contributes to difficulties in diagnosis and treatment. New molecular targets and better molecular profiles defining subsets of patients are needed. tRNA fragments (tRFs) offer a recently identified group of noncoding RNAs that are often as abundant as microRNAs in cancer cells. Initially their presence in deep sequencing data sets was attributed to the breakdown of mature tRNAs, however, it is now clear that they are actively generated and function in multiple regulatory events. One such tRF, a 5' fragment of tRNA-Glu-CTC (tRF5-Glu), is processed from the mature tRNA-Glu and is shown in this study to be expressed in ovarian cancer cells. We confirmed that tRF5-Glu binds directly to a site in the 3'UTR of the Breast Cancer Anti-Estrogen Resistance 3 (BCAR3) mRNA thereby down regulating its expression. BCAR3 has not previously been studied in ovarian cancer cells and our studies demonstrate that inhibiting BCAR3 expression suppresses ovarian cancer cell proliferation. Furthermore, mimics of tRF5-Glu were found to inhibit proliferation of ovarian cancer cells. In summary, BCAR3 and tRF5-Glu contribute to the complex tumor heterogeneity of ovarian cancer cells and may provide new targets for therapeutic intervention.

Keywords: BCAR3; noncoding RNA; ovarian cancer; tRF5-Glu; tRNA fragments.


Conflict of interest statement

CONFLICTS OF INTEREST The authors state no conflicts of interest.

Figures

Figure 1
Figure 1. tRF5-Glu is expressed in ovarian cancer cell lines and HEK293T cells
Ovarian cancer cells were grown to confluence and lysed in passive lysis buffer for fifteen minutes prior to RNA extraction. (A) tRF5-Glu expression was assessed using qRT-PCR. tRF5-Glu expression is shown relative to the expression of the internal control, RNU6B (U6). qRT-PCR experiments are replicates of three independent experiments and error bars refer to +/- standard error. (B) Validation of tRF5-Glu expression by Northern blot analysis. Northern analysis utilized a 5’ biotinylated probe designed to hybridize antisense to the tRF5-Glu region of tRNA-Glu. This probe binds unprocessed tRNA-Glu (greater than 80 base pairs), mature tRNA-Glu (70-80 base pairs) and tRF5-Glu (29-35 base pairs, box). A schematic of the mature tRNA-Glu and the tRF5-Glu is included next to the northern blot showing the mature tRNA-Glu (top) and predominant cleavage sites for tRF5-Glu (bottom). Potential cleavage sites resulting in various size fragments are shown with arrowheads on the schematic of tRF5-Glu. Ethidium bromide stained 5S rRNA below the blot serves as a loading control for the Northern analysis.
Figure 2
Figure 2. The biogenesis of tRF5-Glu is regulated by ANG in ovarian cancer cells
ANG expression was blocked by transfection of cells with ANG siRNA to determine if tRF5-Glu expression is altered. (A) Ligation PCR provides a method to quantify tRF5-Glu, a diagram of the primer placement for Ligation PCR is included. A labeled probe covering the junction between the end of the 3’ linker and target sequence is shown. The linker is designated in grey, the cross junction probe has a star and arrows designate the primers. (B) Ligation PCR of cDNA from PEO1, PEO4, SKOV3, 2008, and OVCAR3 cells transfected with control and ANG siRNAs was conducted. tRF5-Glu expression is compared relative to the internal control U6. Ligation PCR experiments are replicates of three independent experiments and error bars refer to +/- standard error (* p-value <.05). (C) Northern analysis of RNA collected from cells transfected with a control siRNA and two ANG specific siRNAs (ANG siRNA1 and ANG siRNA2). The tRF5-Glu bands are shown within a box.
Figure 3
Figure 3. tRF5-Glu and its potential target BCAR3 are expressed in ovarian cancer cell lines
Ovarian cancer cell lines were grown under estrogen starved (NE) or estrogen stimulated (E) conditions to determine the best conditions to study the potential relationship between tRF5-Glu and BCAR3. (A) Expression of BCAR3 mRNA in cDNA from PEO4 and 2008 cells estrogen starved (NE) or estrogen stimulated (E) as assayed by qRT-PCR. qRT-PCR experiments are replicates of three independent experiments and error bars refer to +/- standard error (** p-value <.01 and *** p-value<.005). (B) Western analysis of BCAR3 protein expression at 48 hours of estrogen starvation (NE) or estrogen stimulation (E) in the two ovarian cancer cell lines. Densitometry of each band was measured and the relative ratio of BCAR3/β-Actin is shown. (C) Expression of tRF5-Glu amplified from cDNA of PEO4 and 2008 cells estrogen starved (NE) or estrogen stimulated (E) as assayed by ligation PCR. (D) Northern analysis of tRF5-Glu in estrogen starved (NE) or estrogen stimulated (E) PEO4 and 2008 cells. Cells were grown for 48 hours in estrogen depleted media and then the media was replaced by new estrogen depleted media (NE) or media supplemented with estrogen for an additional 48 hours (E). Cells were then lysed by direct addition of Qiazol for RNA extraction. The tRF5-Glu bands are shown within a box.
Figure 4
Figure 4. Binding of the BCAR3 mRNA by tRF5-Glu is demonstrated using miR-Catch and luciferase assays
(A) Secondary structure of the BCAR3 mRNA with placement of the DNA capture probe in relationship to the tRF5-Glu binding site is shown with arrows. (B) Triplicate samples of PEO4 cell lysates probed with either BCAR3 or a random probe were amplified by RT-PCR for BCAR3 and tRF5-Glu expression. The BCAR3 mRNA in the flow-through was amplified and is shown for each sample. (C) A schematic of the BCAR3 3’UTR and predicted binding site for tRF5-Glu is shown with the wild type and mutant seed sequences listed below. Luciferase reporter plasmids were constructed containing the predicted binding site intact or mutated at two base pairs within the predicted seed region (designated by underlined letters). (D) Luciferase constructs with the wild type or mutant BCAR3 3’UTR were transfected into HEK293T, PEO4 and 2008 cells with a control mimic or a mimic of tRF5-Glu. Transfections were performed in triplicate. The result was compared to a control mimic and error bars refer to +/- standard error (* p-value <.05 and **** p-value <.001).
Figure 5
Figure 5. Direct regulation of BCAR3 by tRF5-Glu is predicted in TargetScan 6. 2 which shows a binding site for miR-2476/tRF5-Glu in the BCAR3 3’UTR
Mimics and inhibitors of tRF5-Glu were used to determine if BCAR3 is regulated by tRF5-Glu. (A) Western analysis was conducted on protein extracts from PEO4, PEO1, OVCAR3, 2008 and SKOV3 cells, estrogen starved and transfected with either a control mimic, a control inhibitor, a tRF5-Glu mimic or a tRF5-Glu inhibitor. Protein lysates were collected at 48 hours post transfection. Densitometry of each band was measured and the relative ratio of BCAR3/β-Actin is shown. (B) A schematic of the 50 base pair region of the BCAR3 3’UTR and predicted binding site for tRF5-Glu is shown with the wild type and mutant seed sequences listed below. Luciferase reporter plasmids were constructed containing the predicted binding site intact or mutated at two base pairs within the predicted seed region (designated by underlined letters). (C) Luciferase constructs with the wild type or mutant 50bp region of BCAR3 3’UTR were transfected into HEK293T, PEO4 and 2008 cells with a control mimic or a mimic of tRF5-Glu. Transfections were performed in triplicate. The result was compared to a control mimic and error bars refer to +/- standard error (**** p-value <.001).
Figure 6
Figure 6. APA sites in the 3’UTR of BCAR3 are utilized and may prevent regulation by tRF5-Glu
(A) Schematic diagram of the 3’UTR of BCAR3 designating the APA site (black box) and the predicted site for tRF5-Glu binding (grey box). The length of the cloned 3’UTRs for BCAR3 are depicted starting from the stop codon of BCAR3. The primers used for qRT-PCR are designated by solid arrows for the amplicon in the coding region and hatched arrows are used to designate the 3’UTR specific primers. (B) Relative expression of the longest BCAR3 3’UTR to total BCAR3 mRNA assayed by qRT-PCR for PEO4, PEO1, OVCAR3, 2008 and SKOV3 cells. qRT-PCR experiments are replicates of three independent experiments and error bars refer to +/- standard error.
Figure 7
Figure 7. Proliferation of ovarian cancer cells is inhibited by either siRNA to BCAR3 or mimics of tRF5-Glu
(A) PEO4 cells transfected with either a control siRNA, siRNAs targeting BCAR3 or mimics of tRF5-Glu were grown in culture for up to six days and then fixed and assessed by SRB assay. Proliferation measures the overall cell number resulting from the balance of cell division and cell death over time. Values are shown as percent of control (control siRNA transfected cells; set to 100%) at day one, day three and day six. (B) 2008 cells were transfected and grown as described above for PEO4 cells. Cell proliferation experiments are replicates of three independent experiments and error bars refer to +/- standard error. p-value was less than 0.05 for PEO4 and 2008 cells treated with siRNAs to BCAR3 and tRF5-Glu mimic on day six.

References

    1. National Academies of Sciences E, Medicine . Ovarian Cancers: Evolving Paradigms in Research and Care. National Academies Press; Washington, DC: 2016. - PubMed
    1. Levine DA, Karlan BY, Strauss JF. Evolving Approaches in Research and Care for Ovarian Cancers: A Report From the National Academies of Sciences, Engineering, and Medicine. JAMA. 2016;315:1943–4. - PubMed
    1. Konecny GE, Winterhoff B, Wang C. Gene-expression signatures in ovarian cancer: Promise and challenges for patient stratification. Gynecologic oncology. 2016;141:379–85. - PubMed
    1. Nana-Sinkam SP, Croce CM. MicroRNA regulation of tumorigenesis, cancer progression and interpatient heterogeneity: towards clinical use. Genome biology. 2014;15:1. - PMC - PubMed
    1. Telonis AG, Loher P, Jing Y, Londin E, Rigoutsos I. Beyond the one-locus-one-miRNA paradigm: microRNA isoforms enable deeper insights into breast cancer heterogeneity. Nucleic acids research. 2015. - PMC - PubMed