

Disruption of postnatal folliculogenesis and development of ovarian tumor in a mouse model with aberrant transforming growth factor beta signaling
- PMID: 29221447
- PMCID: PMC5723096
- DOI: 10.1186/s12958-017-0312-z
Disruption of postnatal folliculogenesis and development of ovarian tumor in a mouse model with aberrant transforming growth factor beta signaling
Abstract
Background: Transforming growth factor beta (TGFB) superfamily signaling is implicated in the development of sex cord-stromal tumors, a category of poorly defined gonadal tumors. The aim of this study was to determine potential effects of dysregulated TGFB signaling in the ovary using Cre recombinase driven by growth differentiation factor 9 (Gdf9) promoter known to be expressed in oocytes.
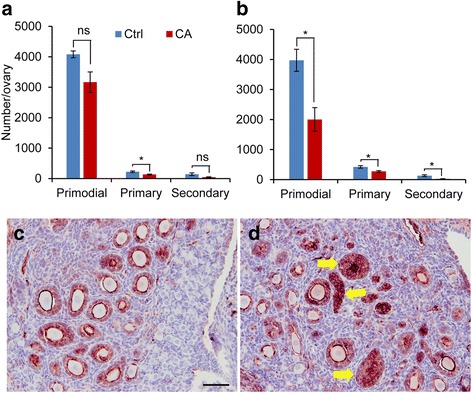
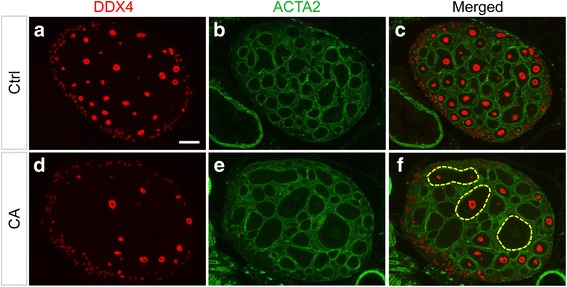
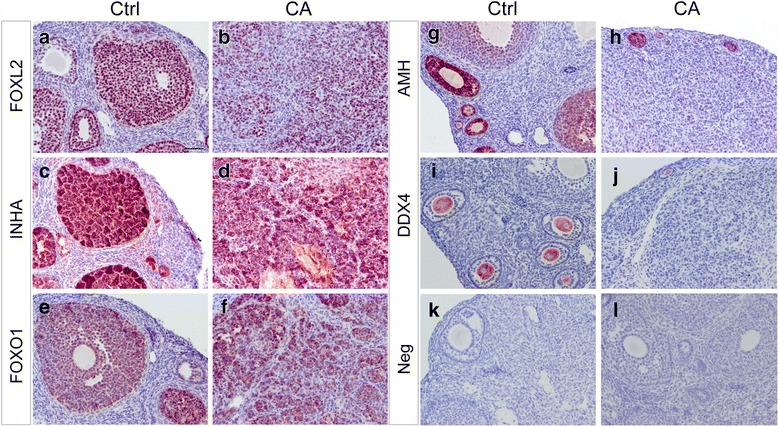
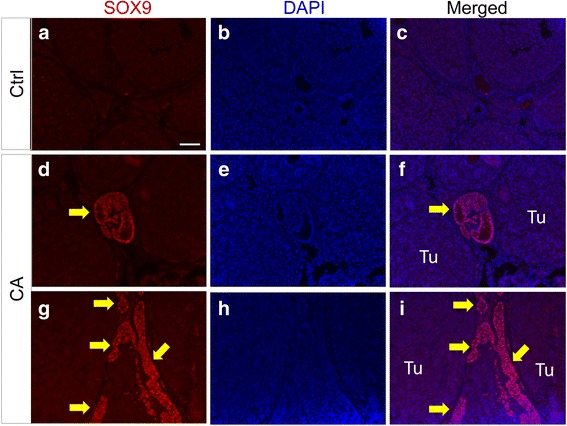
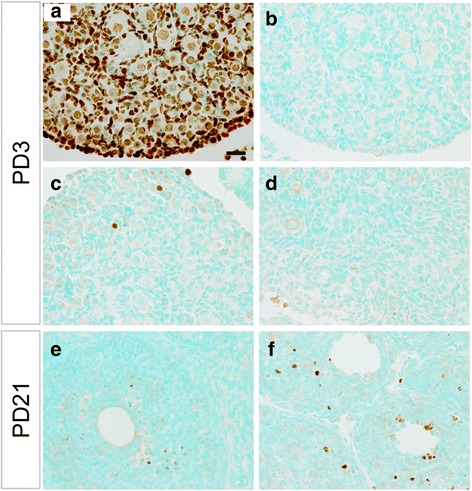
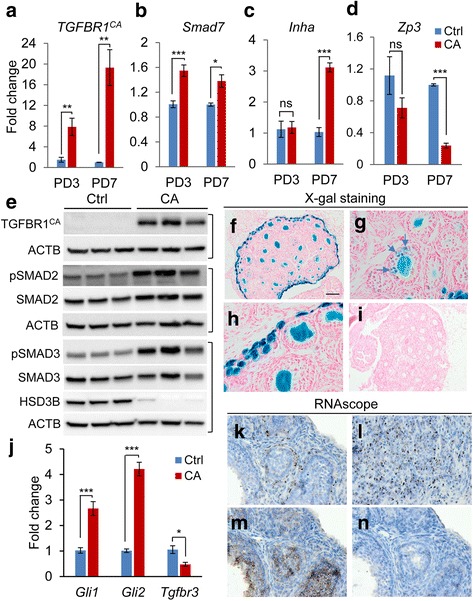
Methods: A mouse model containing constitutively active TGFBR1 (TGFBR1CA) using Gdf9-iCre (termed TGFBR1-CAG9Cre) was generated. Hematoxylin and eosin (H & E) staining, follicle counting, and immunohistochemistry and immunofluorescence analyses using antibodies directed to Ki67, forkhead box L2 (FOXL2), forkhead box O1 (FOXO1), inhibin alpha (INHA), and SRY (sex determining region Y)-box 9 were performed to determine the characteristics of the TGFBR1-CAG9Cre ovary. Terminal deoxynucleotidyl transferase (TdT) labeling of 3'-OH ends of DNA fragments, real-time PCR, and western blotting were used to examine apoptosis, select gene expression, and TGFBR1 activation. RNAscope in situ hybridization was used to localize the expression of GLI-Kruppel family member GLI1 (Gli1) in ovarian tumor tissues.
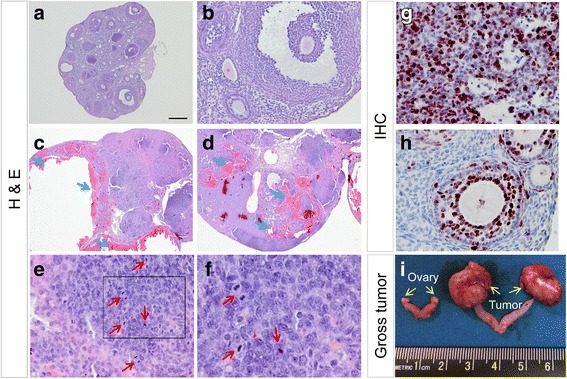
Results: TGFBR1-CAG9Cre females were sterile. Sustained activation of TGFBR1 led to altered granulosa cell proliferation evidenced by high expression of Ki67. At an early age, these mice demonstrated follicular defects and development of ovarian granulosa cell tumors, which were immunoreactive for granulosa cell markers including FOXL2, FOXO1, and INHA. Further histochemical and molecular analyses provided evidence of overactivation of TGFBR1 in the granulosa cell compartment during ovarian pathogenesis in TGFBR1-CAG9Cre mice, along with upregulation of Gli1 and Gli2 and downregulation of Tgfbr3 in ovarian tumor tissues.
Conclusions: These results reinforce the role of constitutively active TGFBR1 in promoting ovarian tumorigenesis in mice. The mouse model created in this study may be further exploited to define the cellular and molecular mechanisms of TGFB/activin downstream signaling in granulosa cell tumor development. Future studies are needed to test whether activation of TGFB/activin signaling contributes to the development of human granulosa cell tumors.
Keywords: Gdf9-iCre; Ovary; TGFB; Tumor.
Conflict of interest statement
Ethics approval and consent to participate
Experimental protocols using mice were approved by the Institutional Animal Care and Use Committee at Texas A&M University.
Consent for publication
Not applicable.
Competing interests
The authors declare that they have no competing interests.
Publisher’s Note
Springer Nature remains neutral with regard to jurisdictional claims in published maps and institutional affiliations.
Figures
Similar articles
-
A novel mouse model of testicular granulosa cell tumors.Mol Hum Reprod. 2018 Jul 1;24(7):343-356. doi: 10.1093/molehr/gay023. Mol Hum Reprod. 2018. PMID: 29788434 Free PMC article.
-
Constitutively active transforming growth factor β receptor 1 in the mouse ovary promotes tumorigenesis.Oncotarget. 2016 Jul 5;7(27):40904-40918. doi: 10.18632/oncotarget.10149. Oncotarget. 2016. PMID: 27344183 Free PMC article.
-
Sertoli Cell-Specific Activation of Transforming Growth Factor Beta Receptor 1 Leads to Testicular Granulosa Cell Tumor Formation.Cells. 2023 Nov 27;12(23):2717. doi: 10.3390/cells12232717. Cells. 2023. PMID: 38067144 Free PMC article.
-
SMAD3 Activation: A Converging Point of Dysregulated TGF-Beta Superfamily Signaling and Genetic Aberrations in Granulosa Cell Tumor Development?Biol Reprod. 2016 Nov;95(5):105. doi: 10.1095/biolreprod.116.143412. Epub 2016 Sep 28. Biol Reprod. 2016. PMID: 27683263 Free PMC article. Review.
-
Impact of FOXL2 mutations on signaling in ovarian granulosa cell tumors.Int J Biochem Cell Biol. 2016 Mar;72:51-54. doi: 10.1016/j.biocel.2016.01.003. Epub 2016 Jan 11. Int J Biochem Cell Biol. 2016. PMID: 26791928 Review.
Cited by
-
Genes responsible for proliferation, differentiation, and junction adhesion are significantly up-regulated in human ovarian granulosa cells during a long-term primary in vitro culture.Histochem Cell Biol. 2019 Feb;151(2):125-143. doi: 10.1007/s00418-018-1750-1. Epub 2018 Oct 31. Histochem Cell Biol. 2019. PMID: 30382374 Free PMC article.
-
Distinct Signaling Pathways Distinguish in vivo From in vitro Growth in Murine Ovarian Follicle Activation and Maturation.Front Cell Dev Biol. 2021 Jul 23;9:708076. doi: 10.3389/fcell.2021.708076. eCollection 2021. Front Cell Dev Biol. 2021. PMID: 34368158 Free PMC article.
-
Lineage tracing of mutant granulosa cells reveals in vivo protective mechanisms that prevent granulosa cell tumorigenesis.Cell Death Differ. 2023 May;30(5):1235-1246. doi: 10.1038/s41418-023-01132-1. Epub 2023 Feb 23. Cell Death Differ. 2023. PMID: 36823373 Free PMC article.
-
In ovo culturing of turkey (Meleagris gallopavo) ovarian tissue to assess graft viability and maturation of prefollicular germ cells and follicles.Poult Sci. 2020 Dec;99(12):7109-7121. doi: 10.1016/j.psj.2020.09.014. Epub 2020 Sep 15. Poult Sci. 2020. PMID: 33248628 Free PMC article.
-
Quality of IVM ovarian tissue oocytes: impact of clinical, demographic, and laboratory factors.J Assist Reprod Genet. 2024 Nov;41(11):3079-3088. doi: 10.1007/s10815-024-03234-2. Epub 2024 Sep 30. J Assist Reprod Genet. 2024. PMID: 39349891 Free PMC article.
References
MeSH terms
Substances
Grants and funding
LinkOut - more resources
Full Text Sources
Other Literature Sources
Medical
Molecular Biology Databases
Research Materials
Miscellaneous
