

A screening system to identify transcription factors that induce binding site-directed DNA demethylation
- PMID: 29221486
- PMCID: PMC5723091
- DOI: 10.1186/s13072-017-0169-6
A screening system to identify transcription factors that induce binding site-directed DNA demethylation
Abstract
Background: DNA methylation is a fundamental epigenetic modification that is involved in many biological systems such as differentiation and disease. We and others recently showed that some transcription factors (TFs) are involved in the site-specific determination of DNA demethylation in a binding site-directed manner, although the reports of such TFs are limited.
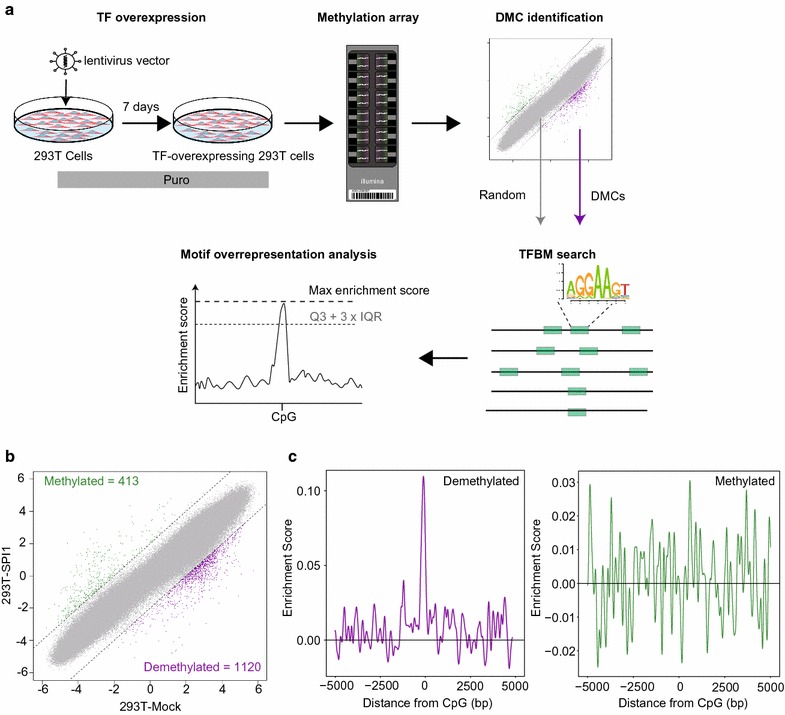
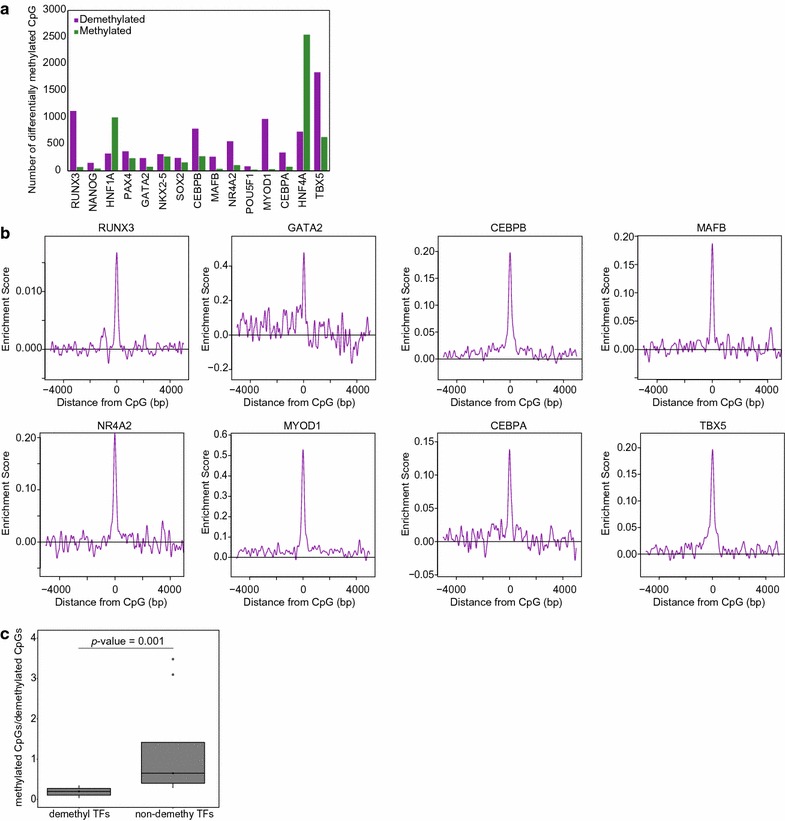
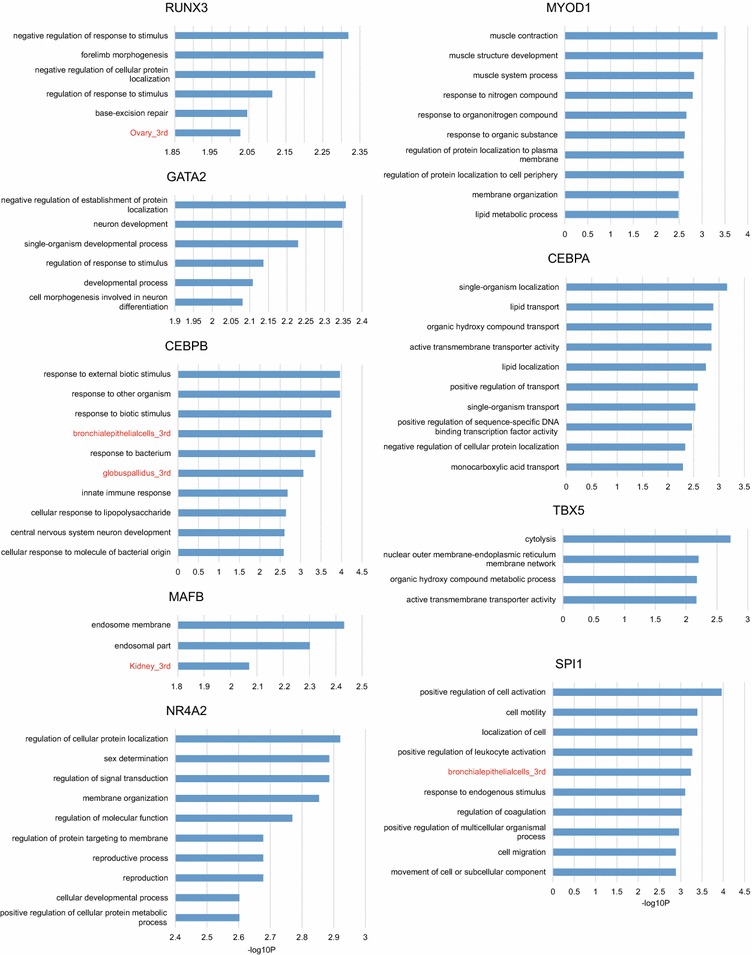
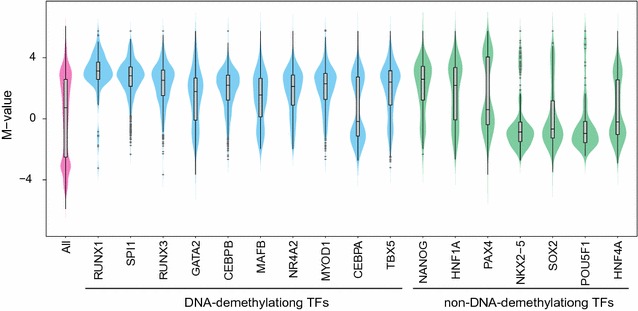
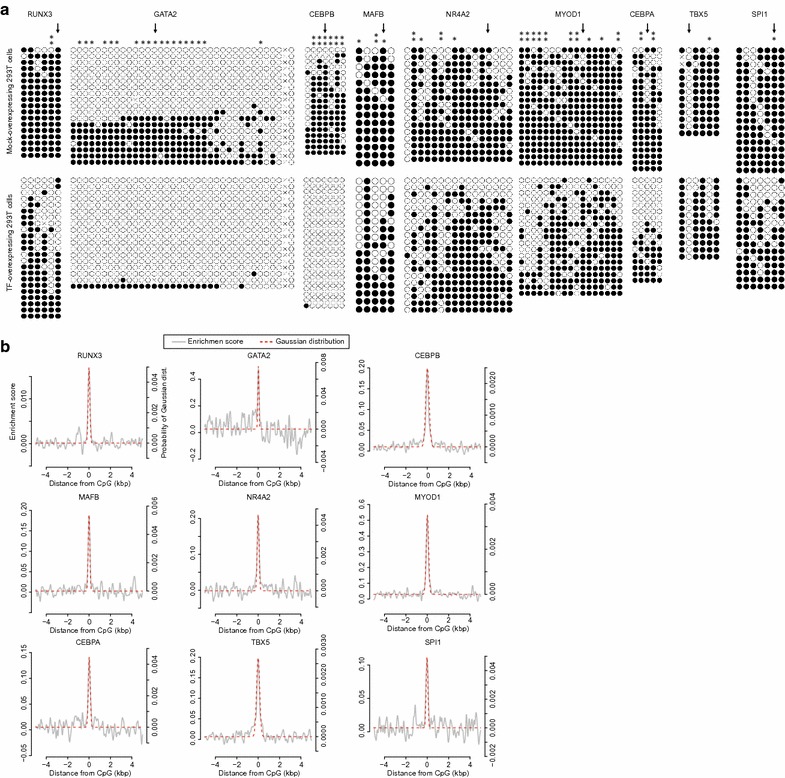
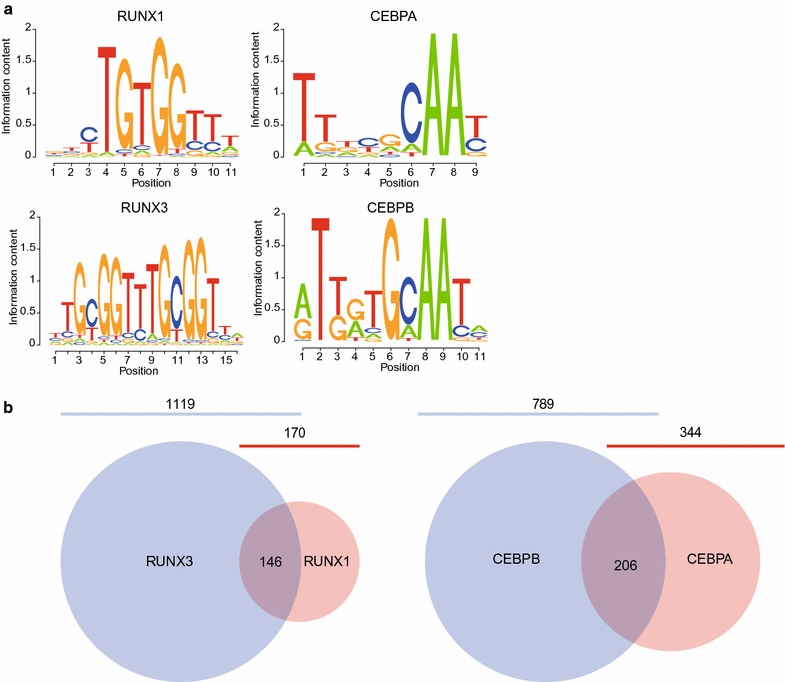
Results: Here, we develop a screening system to identify TFs that induce binding site-directed DNA methylation changes. The system involves the ectopic expression of target TFs in model cells followed by DNA methylome analysis and overrepresentation analysis of the corresponding TF binding motif at differentially methylated regions. It successfully identified binding site-directed demethylation of SPI1, which is known to promote DNA demethylation in a binding site-directed manner. We extended our screening system to 15 master TFs involved in cellular differentiation and identified eight novel binding site-directed DNA demethylation-inducing TFs (RUNX3, GATA2, CEBPB, MAFB, NR4A2, MYOD1, CEBPA, and TBX5). Gene ontology and tissue enrichment analysis revealed that these TFs demethylate genomic regions associated with corresponding biological roles. We also describe the characteristics of binding site-directed DNA demethylation induced by these TFs, including the targeting of highly methylated CpGs, local DNA demethylation, and the overlap of demethylated regions between TFs of the same family.
Conclusions: Our results show the usefulness of the developed screening system for the identification of TFs that induce DNA demethylation in a site-directed manner.
Keywords: Binding site; DNA demethylation; Transcription factor.
Figures
Similar articles
-
Prediction of transcription factors associated with DNA demethylation during human cellular development.Chromosome Res. 2022 Mar;30(1):109-121. doi: 10.1007/s10577-022-09685-6. Epub 2022 Feb 10. Chromosome Res. 2022. PMID: 35142952 Free PMC article.
-
High throughput screening identifies SOX2 as a super pioneer factor that inhibits DNA methylation maintenance at its binding sites.Nat Commun. 2021 Jun 7;12(1):3337. doi: 10.1038/s41467-021-23630-x. Nat Commun. 2021. PMID: 34099689 Free PMC article.
-
RUNX1 regulates site specificity of DNA demethylation by recruitment of DNA demethylation machineries in hematopoietic cells.Blood Adv. 2017 Sep 6;1(20):1699-1711. doi: 10.1182/bloodadvances.2017005710. eCollection 2017 Sep 12. Blood Adv. 2017. PMID: 29296817 Free PMC article.
-
Transcription Factor Binding Site Mapping Using ChIP-Seq.Microbiol Spectr. 2014 Apr;2(2). doi: 10.1128/microbiolspec.MGM2-0035-2013. Microbiol Spectr. 2014. PMID: 26105820 Review.
-
Critical Link Between Epigenetics and Transcription Factors in the Induction of Autoimmunity: a Comprehensive Review.Clin Rev Allergy Immunol. 2016 Jun;50(3):333-44. doi: 10.1007/s12016-016-8534-y. Clin Rev Allergy Immunol. 2016. PMID: 26969025 Review.
Cited by
-
Modification Patterns of DNA Methylation-Related lncRNAs Regulating Genomic Instability for Improving the Clinical Outcomes and Tumour Microenvironment Characterisation of Lower-Grade Gliomas.Front Mol Biosci. 2022 Mar 10;9:844973. doi: 10.3389/fmolb.2022.844973. eCollection 2022. Front Mol Biosci. 2022. PMID: 35359593 Free PMC article.
-
Transcriptomic Alterations in Lung Adenocarcinoma Unveil New Mechanisms Targeted by the TBX2 Subfamily of Tumor Suppressor Genes.Front Oncol. 2018 Oct 30;8:482. doi: 10.3389/fonc.2018.00482. eCollection 2018. Front Oncol. 2018. PMID: 30425966 Free PMC article.
-
A method for identifying allele-specific hydroxymethylation.Epigenetics. 2020 Mar;15(3):231-250. doi: 10.1080/15592294.2019.1664228. Epub 2019 Sep 18. Epigenetics. 2020. PMID: 31533538 Free PMC article.
-
RUNX1/CEBPA Mutation in Acute Myeloid Leukemia Promotes Hypermethylation and Indicates for Demethylation Therapy.Int J Mol Sci. 2022 Sep 27;23(19):11413. doi: 10.3390/ijms231911413. Int J Mol Sci. 2022. PMID: 36232714 Free PMC article.
-
Sensitivity of transcription factors to DNA methylation.Essays Biochem. 2019 Dec 20;63(6):727-741. doi: 10.1042/EBC20190033. Essays Biochem. 2019. PMID: 31755929 Free PMC article. Review.
References
-
- Shames DS, Girard L, Gao B, Sato M, Lewis CM, Shivapurkar N, Jiang A, Perou CM, Kim YH, Pollack JR, et al. A genome-wide screen for promoter methylation in lung cancer identifies novel methylation markers for multiple malignancies. PLoS Med. 2006;3(12):e486. doi: 10.1371/journal.pmed.0030486. - DOI - PMC - PubMed
-
- Baldwin RL, Nemeth E, Tran H, Shvartsman H, Cass I, Narod S, Karlan BY. BRCA1 promoter region hypermethylation in ovarian carcinoma: a population-based study. Cancer Res. 2000;60(19):5329–5333. - PubMed
Publication types
MeSH terms
Substances
LinkOut - more resources
Full Text Sources
Other Literature Sources
Molecular Biology Databases
Research Materials
Miscellaneous
