. 2017 Dec 19;47(6):1037-1050.e6.
doi: 10.1016/j.immuni.2017.11.001. Epub 2017 Dec 5.

High-Dimensional Phenotypic Mapping of Human Dendritic Cells Reveals Interindividual Variation and Tissue Specialization

Affiliations

High-Dimensional Phenotypic Mapping of Human Dendritic Cells Reveals Interindividual Variation and Tissue Specialization

Marcela Alcántara-Hernández et al. Immunity. .

Abstract

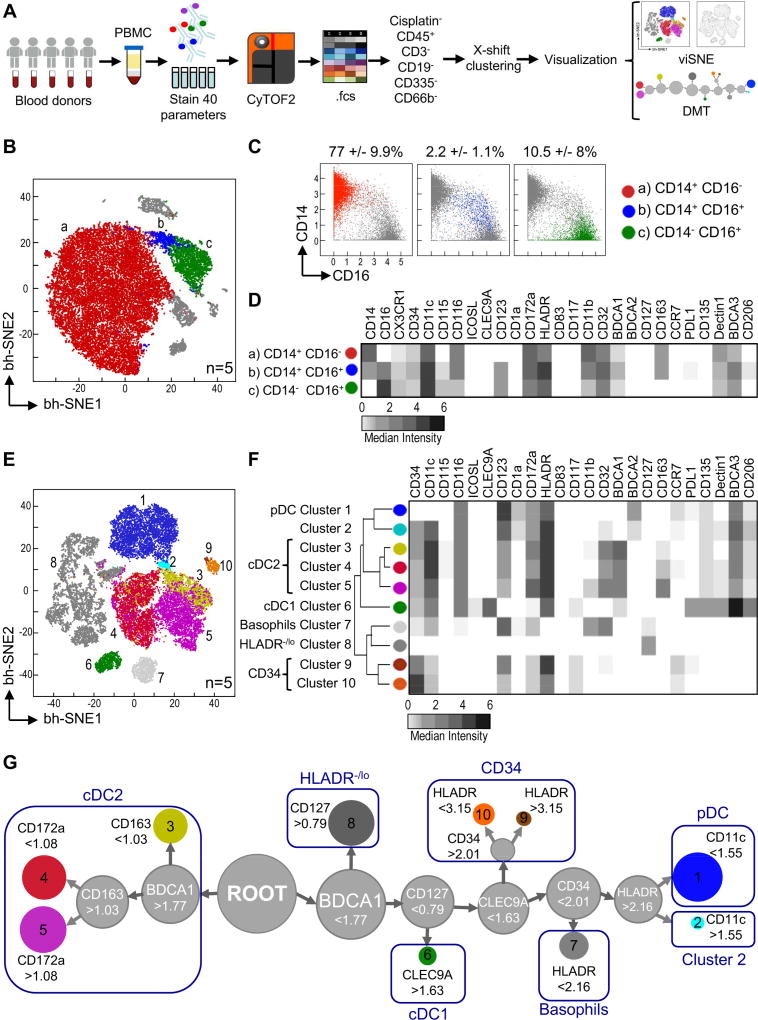
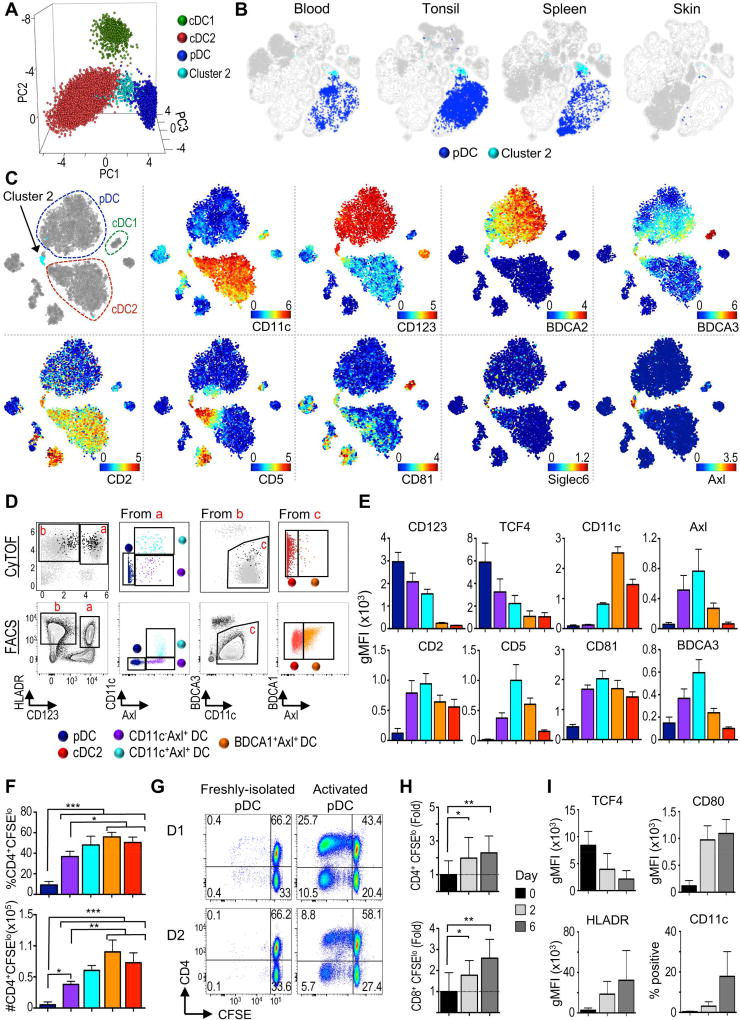
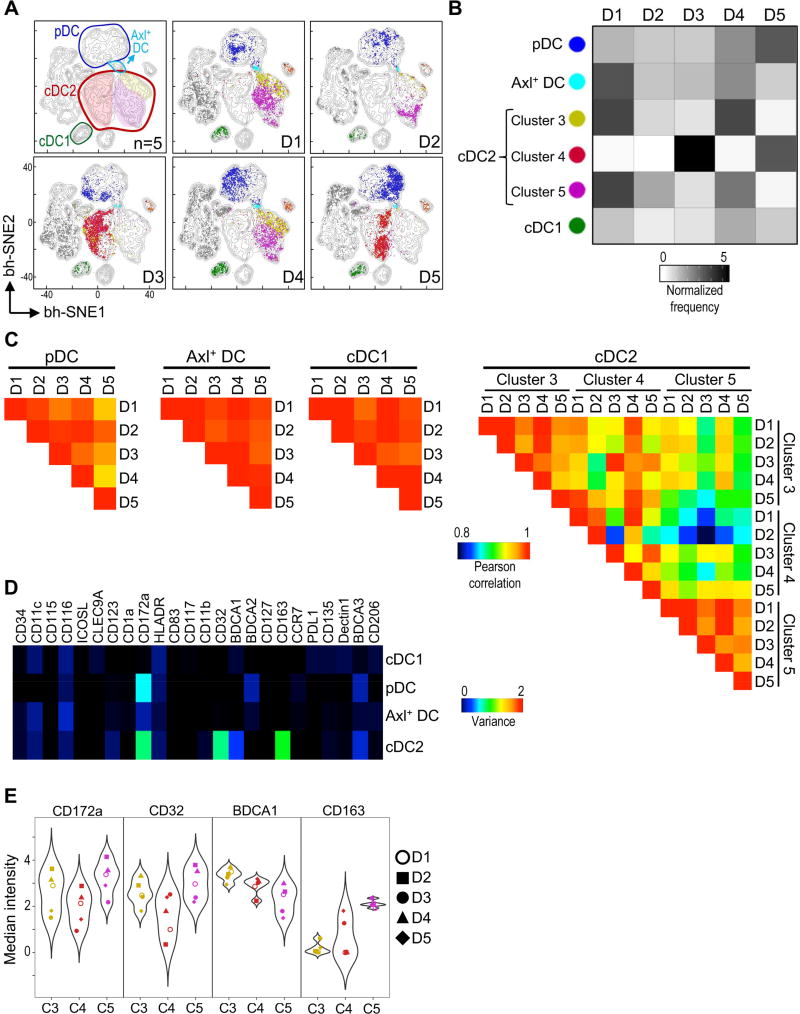
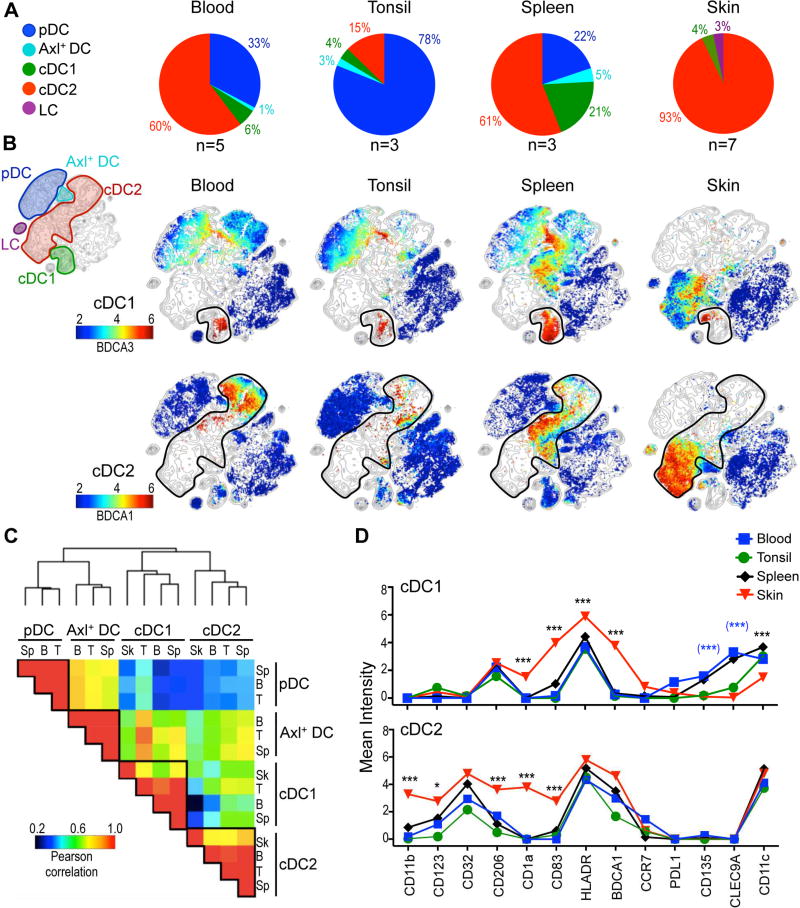
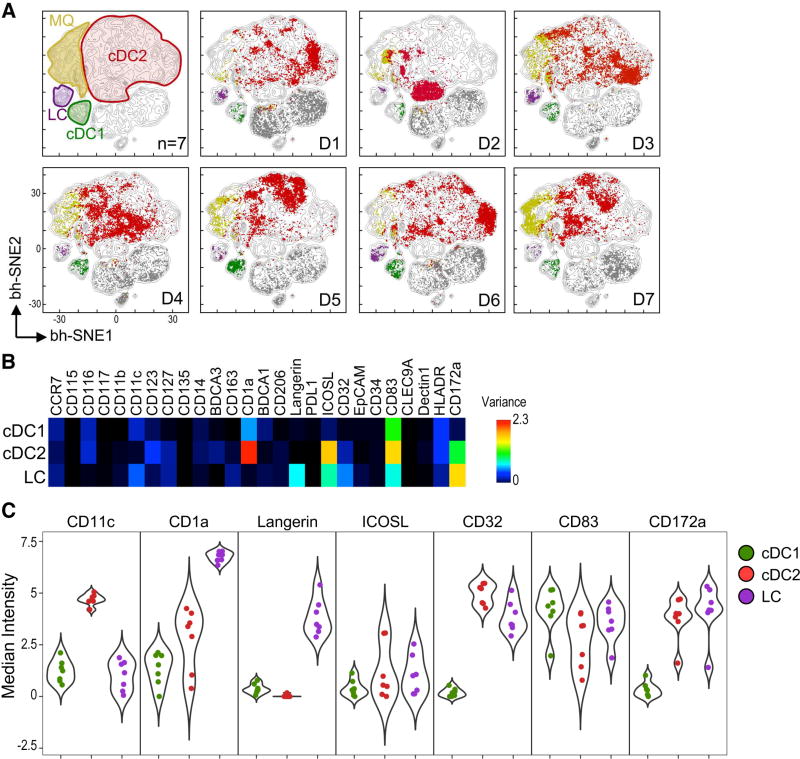
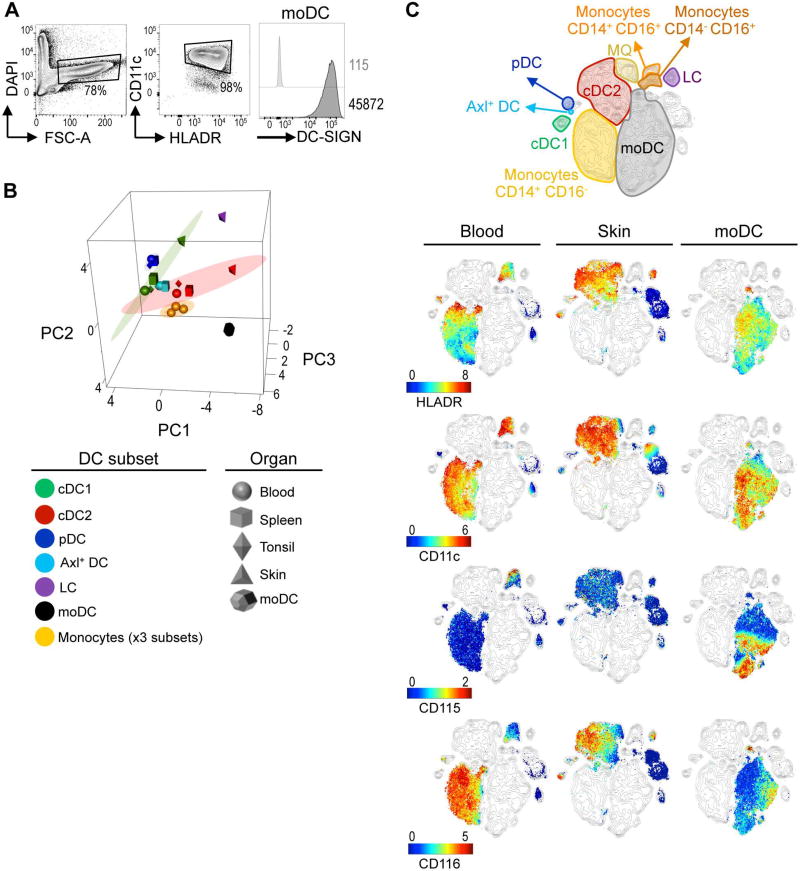
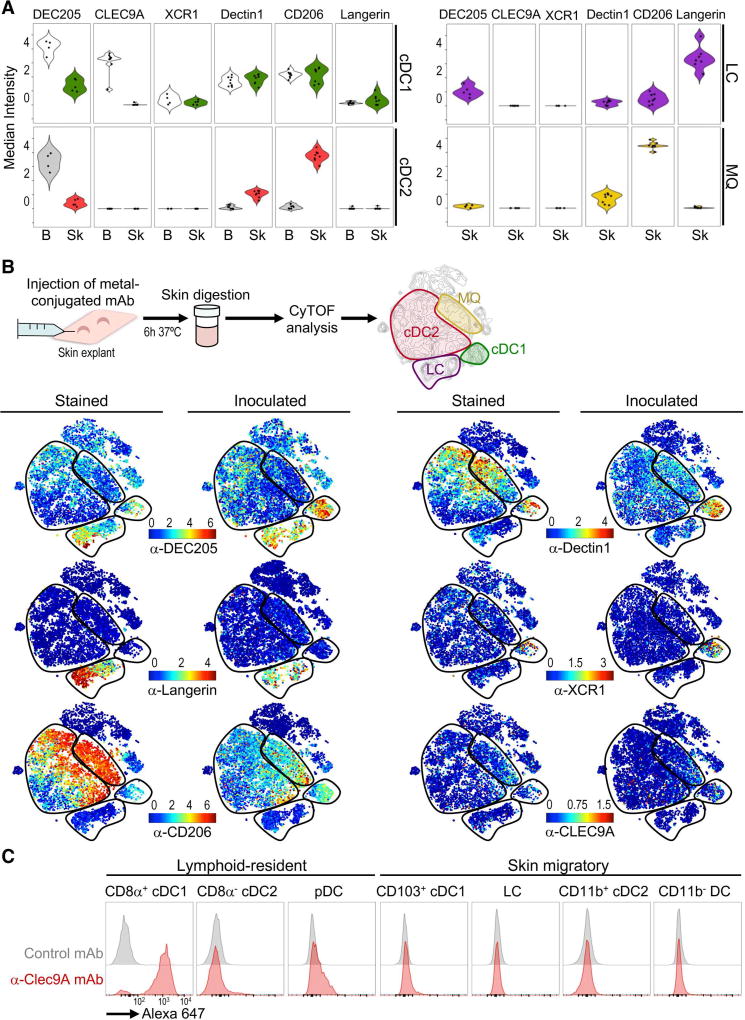
Given the limited efficacy of clinical approaches that rely on ex vivo generated dendritic cells (DCs), it is imperative to design strategies that harness specialized DC subsets in situ. This requires delineating the expression of surface markers by DC subsets among individuals and tissues. Here, we performed a multiparametric phenotypic characterization and unbiased analysis of human DC subsets in blood, tonsil, spleen, and skin. We uncovered previously unreported phenotypic heterogeneity of human cDC2s among individuals, including variable expression of functional receptors such as CD172a. We found marked differences in DC subsets localized in blood and lymphoid tissues versus skin, and a striking absence of the newly discovered Axl+ DCs in the skin. Finally, we evaluated the capacity of anti-receptor monoclonal antibodies to deliver vaccine components to skin DC subsets. These results offer a promising path for developing DC subset-specific immunotherapies that cannot be provided by transcriptomic analysis alone.

Keywords: Axl+ dendritic cells; C-type lectins; CyTOF; antibody targeting; dendritic cells; human; interindividual variation; plasmacytoid dendritic cells; subsets; tissue specialization.


Figures

Figure 1
Figure 1. Unsupervised CyTOF analysis of myeloid cells in human blood
(A) Schematic of experimental design and analysis of 5 donors in 4 independent exp. using CyTOF panel 1. (B) X-shift delineated clusters (a, b and c) were manually colored. (C) Biaxial plots of CD14 and CD16 expression for clusters identified in B. Shown is frequency +/− SD of Lin events. (D) Heatmap of marker median intensity in clusters detected in B. (E) As in B, but X-shift clusters were delineated after CD14+ and CD16+ exclusion. (F) Heatmap of marker median intensity in clusters identified in E. (G) DMT representing clusters identified in E. Shown are marker cutoff values that define each sub-branch. Please see Figure S1 for CyTOF validation and PCC of donors’ monocytes.
Figure 2
Figure 2. Tissue distribution and characterization of Axl+ DC
(A) PCA of cDC1, pDC, cDC2 (clusters 3–5) and cluster2 identified in Fig. 1E. (B) viSNE contour map of merged data from all organs and individuals was overlaid with pDC and cluster 2. (C) viSNE of PBMC analyzed with CyTOF Panel 2 (n=1). (D) Upper: Biaxial plots of CyTOF data from C. Black dots represent gated Axl+ cells. Lower: Flow cytometry gating strategy (1 representative of 4 donors in 2 independent exp.). (E) gMFI is shown for populations gated as in D (n=4, 1 of 2 independent exp.). (F) MLR for sorted populations from D (n=2, 2 independent exp.). (G) MLR of “pure” Axl pDC freshly-isolated or after 2d culture with CD40L+IL-3 (2 representative donors). (H) As in G, but expressed as fold change +/− SD relative to average of freshly-isolated pDC (n=7, 4 independent exp.) (I) gMFI of markers and percentage CD11c+ in “pure” Axl pDC cultured with CD40L+IL-3 for 0, 2, or 6d (n=6–7, 4–5 independent exp.). Please see Figure S2 for additional phenotypic profiling of Axl+ DC by flow cytometry and CyTOF, and Figure S3 for sort strategy and purity.
Figure 3
Figure 3. Circulating cDC2 are highly heterogeneous among healthy individuals
(A) viSNE contour map of merged data from Figure 1E was overlaid with each donor’s plot (D1–5). Axl+ DC refers to cluster 2 (CD11c+Axl+). (B) Heatmap of normalized frequency of DC clusters in each donor (D1–5). (C) PCC calculated between donors. All cDC2 clusters analyzed had >5 cells per donor. (D) Heatmap of marker variance across donors and clusters for each population. (E) Violin plots of highly variable markers in cDC2 of each donor (D1–5). Please see Figure S4 for phenotypic profiling at the single cell level.
Figure 4
Figure 4. Skin DC subsets are different from blood and lymphoid tissues
(A) Frequency of DC subsets in each tissue (n=3–7, 1–5 independent exp.). Numbers represent relative contribution of each subset to total DC pool. Axl+ DC refers to cluster 2 (CD11c+Axl+). (B) viSNE contour map of all organs and individuals was overlaid with each organ (columns). DC subsets were manually annotated (rows). Colors represent expression of BDCA3 and BDCA1 (rows). Analysis was performed with CyTOF panel 1. (C) Clustered heatmap of PCC based on phenotype for tissues analyzed in A. (D) Expression of markers in cDC1 and cDC2 from tissues analyzed in A. Statistics for skin vs. other organs in black; skin vs. blood in blue and brackets.
Figure 5
Figure 5. Skin DC subsets are highly heterogeneous between individuals
(A) viSNE contour map of merged skin data (n=7, 5 independent exp.) was overlaid with a plot for each donor (D1–7). DC subsets were manually annotated. (B) Heatmap of marker variance across donors (n=7) in skin DC subsets. (C) Violin plots of highly variable surface markers in skin DC. Each dot represents a donor. Please see Figure S5 for PCC of skin DC subsets.
Figure 6
Figure 6. moDC differ from in situ DC subsets
(A) FACS analysis of in vitro generated moDC (1 representative of 2 independent exp.). (B) PCA of moDC and myeloid subsets from tissues and donors analyzed in Figure 4. Ellipse marks 95% confidence region for each cell type. (C) viSNE contour map generated from merged blood, skin, and moDC (n=2–7, 2–5 independent exp.) data was overlaid with each sample type (columns), colored by marker expression (rows). Please see Figure S6 for PCA variance.
Figure 7
Figure 7. Uptake of anti-receptor mAb by skin DC subsets
(A) Violin plots of uptake receptors in blood and skin myeloid subsets analyzed using CyTOF panel 3. Each dot represents a donor (n=4–7, 6 independent exp.). (B) Schematic of the mAb inoculation (upper panel). Individual viSNE display expression (Stained) or capture (Inoculated) of mAb (1 representative of 3 independent exp.). (C) Uptake of A647-labeled anti-Clec9A–or control mAb in C57BL/6 mice 24h after s.c. inoculation (1 representative of 2 exp.). Please see Figure S7 for blood vs. skin comparison and flow cytometry validation of mAb capturing.

Similar articles

Cited by

References

    1. Adema GJ, de Vries IJM, Punt CJ, Figdor CG. Migration of dendritic cell based cancer vaccines: in vivo veritas? Current Opinion in Immunology. 2005;17:170–174. - PubMed
    1. Amir E-AD, Davis KL, Tadmor MD, Simonds EF, Levine JH, Bendall SC, Shenfeld DK, Krishnaswamy S, Nolan GP, Pe’er D. viSNE enables visualization of high dimensional single-cell data and reveals phenotypic heterogeneity of leukemia. Nat. Biotechnol. 2013;31:545–552. - PMC - PubMed
    1. Balan S, Ollion V, Colletti N, Chelbi R, Montanana-Sanchis F, Liu H, Manh T-PV, Sanchez C, Savoret J, Perrot I, et al. Human XCR1+ Dendritic Cells Derived In Vitro from CD34+ Progenitors Closely Resemble Blood Dendritic Cells, Including Their Adjuvant Responsiveness, Contrary to Monocyte-Derived Dendritic Cells. J Immunol. 2014;193:1622–1635. - PMC - PubMed
    1. Banchereau J, Steinman RM. Dendritic cells and the control of immunity. Nature. 1998;392:245–252. - PubMed
    1. Bigley V, McGovern N, Milne P, Dickinson R, Pagan S, Cookson S, Haniffa M, Collin M. Langerin-expressing dendritic cells in human tissues are related to CD1c+ dendritic cells and distinct from Langerhans cells and CD141high XCR1+ dendritic cells. Journal of Leukocyte Biology. 2015;97:627–634. - PMC - PubMed

Publication types

MeSH terms