. 2018 Feb;17(2):216-232.
doi: 10.1074/mcp.RA117.000470. Epub 2017 Dec 8.

The interactome of intact mitochondria by cross-linking mass spectrometry provides evidence for coexisting respiratory supercomplexes

Affiliations

The interactome of intact mitochondria by cross-linking mass spectrometry provides evidence for coexisting respiratory supercomplexes

Fan Liu et al. Mol Cell Proteomics. 2018 Feb.

Abstract

Mitochondria exert an immense amount of cytophysiological functions, but the structural basis of most of these processes is still poorly understood. Here we use cross-linking mass spectrometry to probe the organization of proteins in native mouse heart mitochondria. Our approach provides the largest survey of mitochondrial protein interactions reported so far. In total, we identify 3,322 unique residue-to-residue contacts involving half of the mitochondrial proteome detected by bottom-up proteomics. The obtained mitochondrial protein interactome gives insights in the architecture and submitochondrial localization of defined protein assemblies, and reveals the mitochondrial localization of four proteins not yet included in the MitoCarta database. As one of the highlights, we show that the oxidative phosphorylation complexes I-V exist in close spatial proximity, providing direct evidence for supercomplex assembly in intact mitochondria. The specificity of these contacts is demonstrated by comparative analysis of mitochondria after high salt treatment, which disrupts the native supercomplexes and substantially changes the mitochondrial interactome.


Figures

Fig. 1.
Fig. 1.
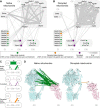
The XL-MS-based mitochondrial interactome. (A) Overview of all protein–protein contacts observed by XL-MS. (B) Contacts observed between selected groups of mitochondrial proteins. Shown are only proteins with interprotein links. All abbreviations are explained in the main text, except for ETF = electron transfer flavoprotein, Cycs = cytochrome c, Ckmt2 = mitochondrial creatine kinase, MICOS = mitochondrial contact site and cristae organizing system, SAM = sorting and assembly machinery. (C) Cross-link coverage for subunits of the major protein complexes in the inner mitochondrial membrane. (D) Matrix of pairwise protein–protein contacts either observed by XL-MS (“Experimental”) or calculated assuming random cross-link formation (“Randomized”, i.e. only based on protein abundance and number of Lys residues). Proteins are sorted based on their intensity-based absolute quantification values. The right plot shows an expanded view of the 20 most abundant proteins of the left plot.
Fig. 2.
Fig. 2.
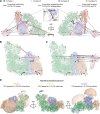
Subcompartment localization of example proteins and validation of the XL-MS approach. (A) Submitochondrial interaction networks of the ETC complexes CIII and CIV. Only interaction partners with known submitochondrial localizations are displayed. Those localizations are indicated using color. (B) Mapping of the detected cross-links (black lines) onto high-resolution structures of selected mitochondrial protein complexes. If the cross-link location is ambiguous (e.g. in homodimers) all possible locations are displayed. The distribution of observed Cα–Cα distances is shown in the top right corner. Here, every unique cross-link was counted once.
Fig. 3.
Fig. 3.
Structural analysis of the ETC supercomplexes. (A) Cross-links mapped onto a pseudo-atomic model of the CI-CIII2-CIV supercomplex (PDB codes 5J4Z and 5LNK, Methods) and a crystal structure of CII (PDB code 1ZOY). Structurally uncharacterized regions are represented by sequence bars. (B, C) 90° tilted view of A, showing the cross-links within CI-CIII2-CIV (B) and toward CII (C). Cross-links are color-coded as in A. Red asterisks indicate red cross-links that appear darker because they are overlaid by parts of the structure. (D) Alternative interaction space models of the ETC complexes CIII and CIV. The interaction spaces models were calculated based on cross-links that disagree with the CI-CIII2-CIV supercomplex model (red lines in A) and are shown as semitransparent surfaces.
Fig. 4.
Fig. 4.
Disruption of the ETC supercomplexes. (A) Western blot analysis showing temperature and dose dependence of salt-induced supercomplex disruption. Colored asterisks indicate the untreated state (show in green) and the salt-treated state (shown in orange). (B–E) Comparative XL-MS analysis of native and disrupted mitochondria. (B) Number of cross-links identified in native and disrupted mitochondria. (C) Pearson correlation of the number of pairwise protein contacts between biological replicates of the same state (native versus native and disrupted versus disrupted) and different states (native versus disrupted). (D) Interaction network of disrupted mitochondria. Proteins are arranged as in Fig. 1B. Significant changes of protein abundances are indicated in color. Significance was measured by a one-sided t test (p < 0.05) and abundance changes were determined by label-free quantification. (E) Disruption-induced changes in the connectivity of CI, CIII, and CIV. The line width indicates the number of unique residue-to-residue cross-links between the displayed complexes. Lines are color-coded according to the origin of the cross-links (green: only detected in native mitochondria, orange: only detected in disrupted mitochondria, purple: detected in both conditions).
Fig. 5.
Fig. 5.
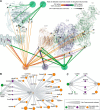
Interactions among the OXPHOS complexes in native and disrupted mitochondria. (A, B) Cross-links among structurally characterized subunits of CII, CV, and the CI-CIII-CIV supercomplex in native (A) and disrupted (B) mitochondria. Shown are only subunits included in published high-resolution structures of mammalian OXPHOS complexes. Subunit coloring indicates their interaction pattern. Ndufa12 has two colors because it shows two distinct sets of interaction partners in native and disrupted state. (C) OXPHOS connectivity maps. The line width indicates the number of unique residue-to-residue cross-links. Lines are color-coded according to the origin of the cross-links (green: only detected in native mitochondria, orange: only detected in disrupted mitochondria, purple: detected in both conditions). (D) Structural representation of CII-CV cross-links in both conditions (PDB codes 1ZOY and 5ARA).
Fig. 6.
Fig. 6.
Effects of mitochondrial disruption on selected interaction partners of the OXPHOS complexes. (A) Differential regulation of protein interaction patterns upon disruption. The CI-CIII2-CIV supercomplex (right) and CV (left) are shown as semitransparent cartoon models. Structurally uncharacterized ATP synthase subunits are schematically depicted. Lys residues involved in cross-links are displayed as black spheres. The line color indicates under which condition the respective connection is prevalently detected. The line width indicates the number of unique residue-to-residue cross-links. CII showed only one interlink to the interacting proteins (to Ndufa4 in disrupted mitochondria) and is therefore not depicted. (B, C) Interaction networks of Ndufa4 (B) and Aifm1 (C) in native and salt-treated mitochondria.

References

    1. Malty R. H., Jessulat M., Jin K., Musso G., Vlasblom J., Phanse S., Zhang Z., and Babu M. (2015) Mitochondrial targets for pharmacological intervention in human disease. J. Proteome Res. 14, 5–21 - PMC - PubMed
    1. Pagliarini D. J., Calvo S. E., Chang B., Sheth S. A., Vafai S. B., Ong S.-E., Walford G. A., Sugiana C., Boneh A., Chen W. K., Hill D. E., Vidal M., Evans J. G., Thorburn R. Dr., Carr S. A., and Mootha V. K. (2008) A mitochondrial protein compendium elucidates complex I disease biology. Cell 134, 112–123 - PMC - PubMed
    1. Pagliarini D. J., and Rutter J. (2013) Hallmarks of a new era in mitochondrial biochemistry. Genes Dev. 27, 2615–2627 - PMC - PubMed
    1. Hodgkinson A., Idaghdour Y., Gbeha E., Grenier J.-C., Hip-Ki E., Bruat V., Goulet J. P., de Malliard T., and Awadalla P. (2014) High-resolution genomic analysis of human mitochondrial RNA sequence variation. Science 344, 413–415 - PubMed
    1. Smith D. R. (2016) The past, present and future of mitochondrial genomics: Have we sequenced enough mtDNAs? Brief. Funct. Genomics 15, 47–54 - PMC - PubMed

Publication types