. 2018 Mar;16(3):528-542.
doi: 10.1158/1541-7786.MCR-17-0272. Epub 2017 Dec 8.

Nanoscale Tuning of VCAM-1 Determines VLA-4-Dependent Melanoma Cell Plasticity on RGD Motifs

Affiliations

Nanoscale Tuning of VCAM-1 Determines VLA-4-Dependent Melanoma Cell Plasticity on RGD Motifs

Katharina Amschler et al. Mol Cancer Res. 2018 Mar.

Abstract

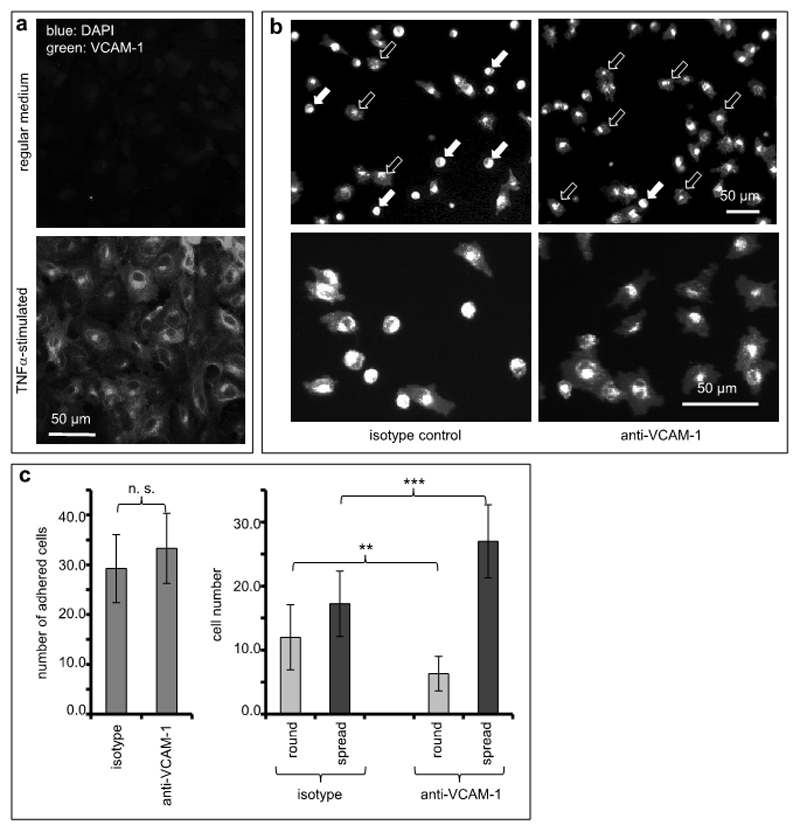
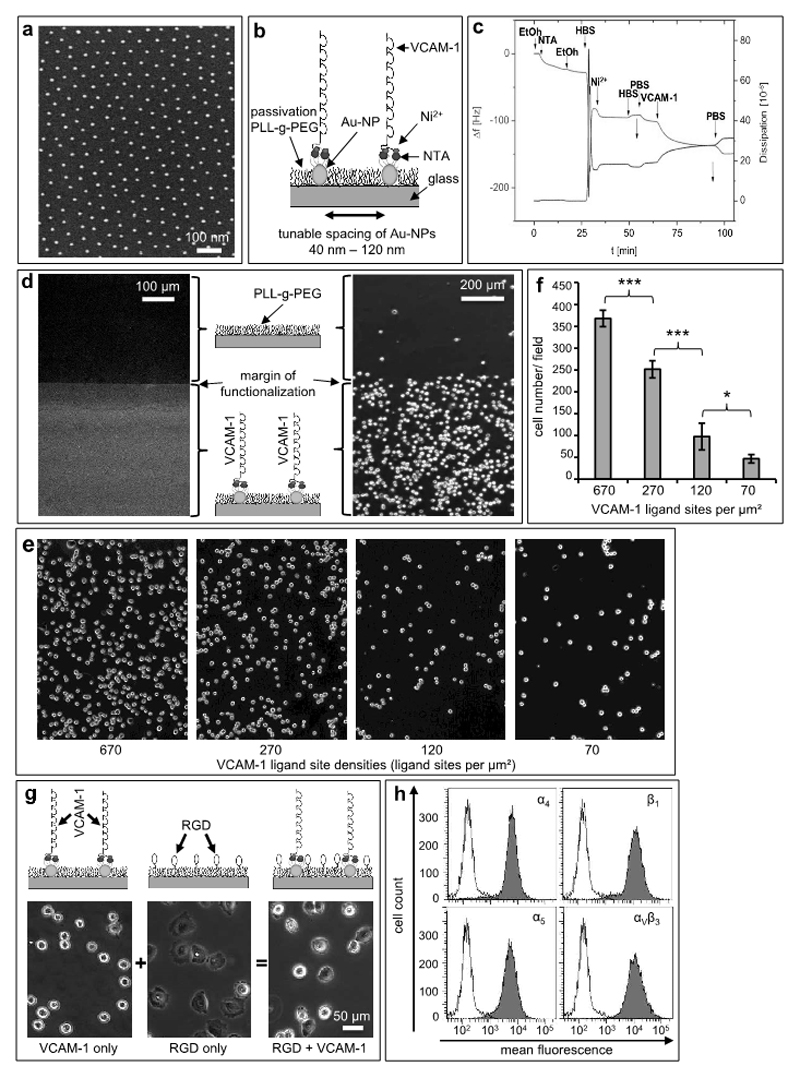
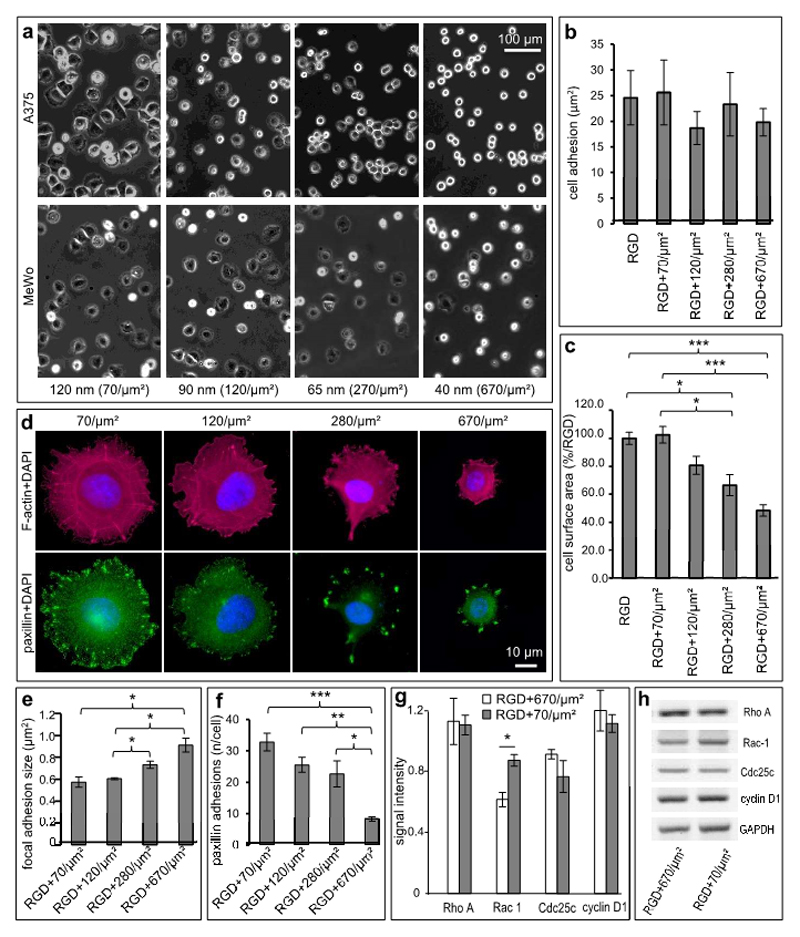
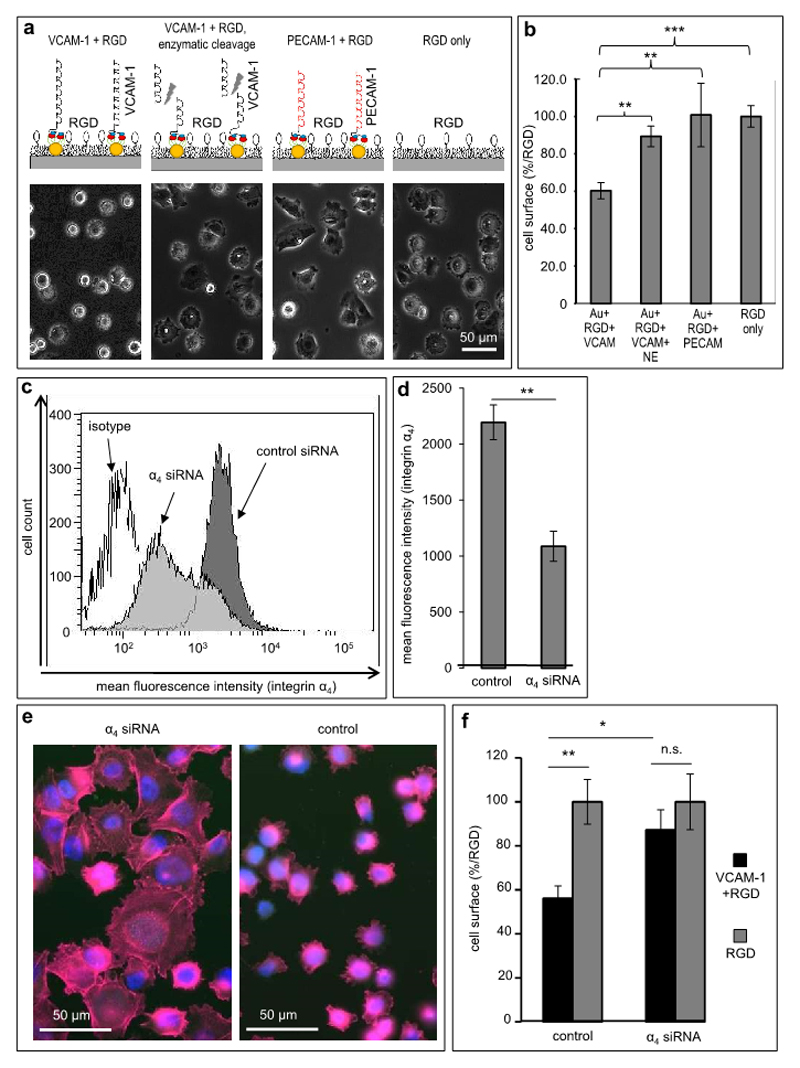
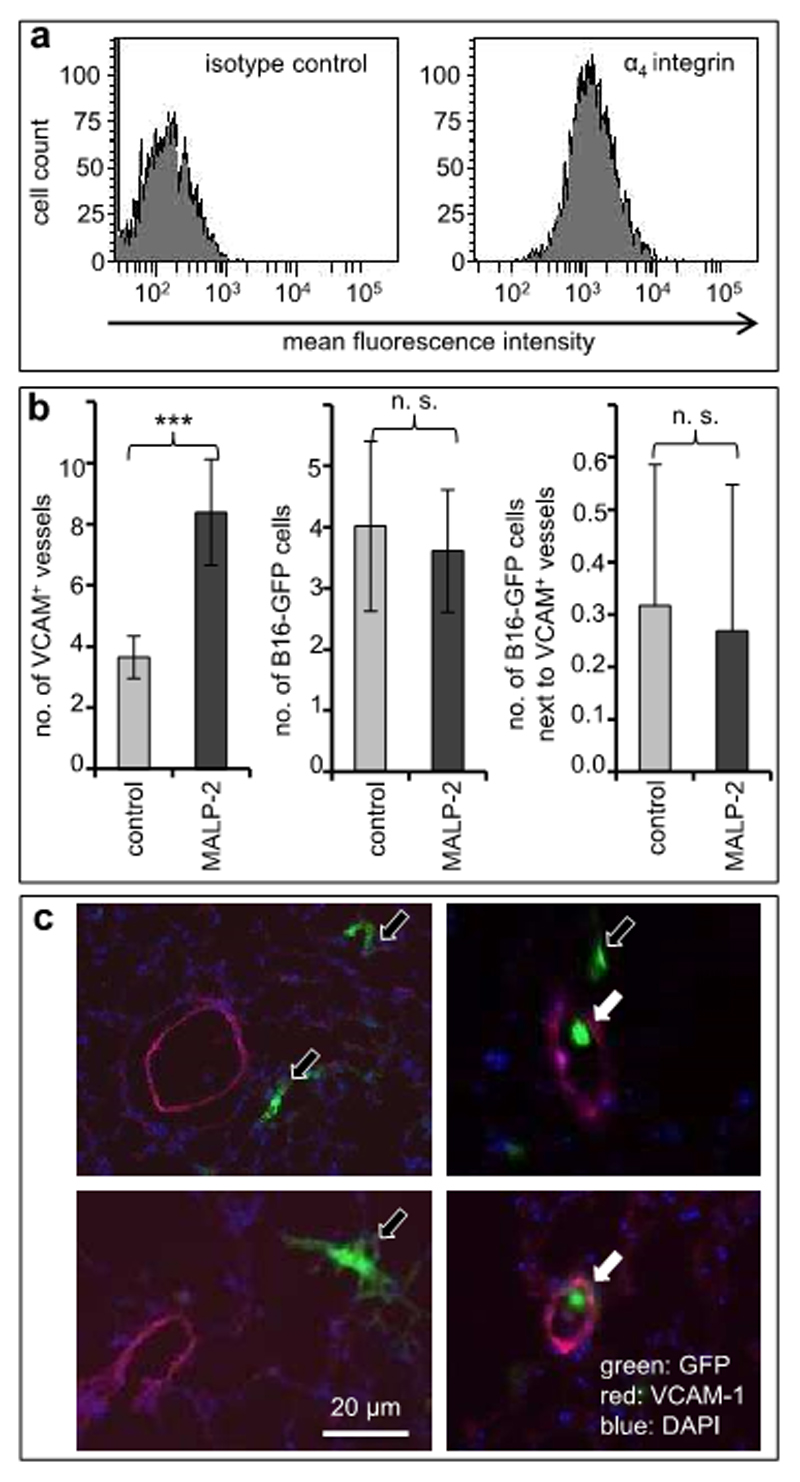
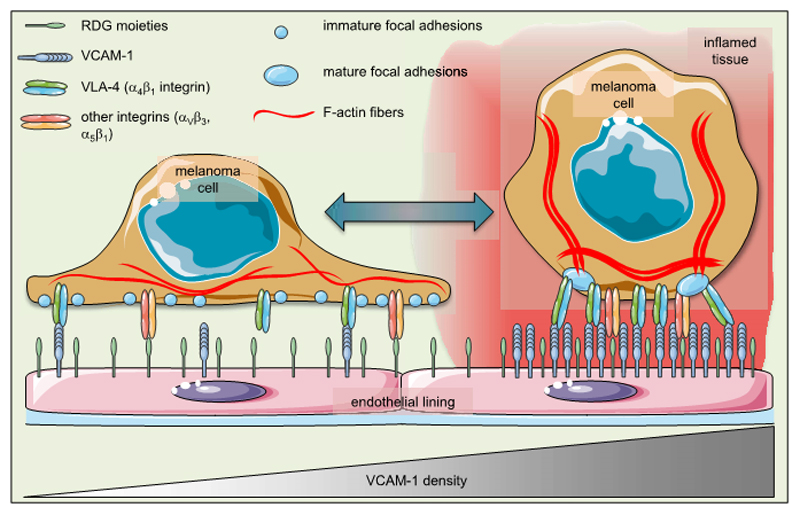
The biophysical fine-tuning of cancer cell plasticity is crucial for tumor progression but remains largely enigmatic. Although vascular cell adhesion molecule-1 (VCAM-1/CD106) has been implicated in melanoma progression, here its presentation on endothelial cells was associated with diminished melanoma cell spreading. Using a specific nanoscale modulation of VCAM-1 (tunable from 70 to 670 ligands/μm²) next to integrin ligands (RGD motifs) in a bifunctional system, reciprocal regulation of integrin α4 (ITGA4/VLA-4/CD49d)-dependent adhesion and spreading of melanoma cells was found. As the VCAM-1/VLA-4 receptor pair facilitated adhesion, while at the same time antagonizing RGD-mediated spreading, melanoma cell morphogenesis on these bifunctional matrices was directly regulated by VCAM-1 in a dichotomic and density-dependent fashion. This was accompanied by concordant regulation of F-actin cytoskeleton remodeling, Rac1-expression, and paxillin-related adhesion formation. The novel function of VCAM-1 was corroborated in vivo using two murine models of pulmonary metastasis. The regulation of melanoma cell plasticity by VCAM-1 highlights the complex regulation of tumor-matrix interactions.Implications: Nanotechnology has revealed a novel dichotomic function of the VCAM-1/VLA-4 interaction on melanoma cell plasticity, as nanoscale tuning of this interaction reciprocally determines adhesion and spreading in a ligand density-dependent manner. Mol Cancer Res; 16(3); 528-42. ©2017 AACR.


Figures

Figure 1
Figure 1. VCAM-1 inhibition facilitates melanoma cell spreading on endothelial cells.
(a) Human endothelial cells were cultured without (top panel) or in the presence of TNFα (25 ng/ml, bottom panel) to stimulate expression of adhesion molecules. Expression of VCAM-1 was visualized by immunofluorescence. (b) Human endothelial cells stimulated with TNFα and expressing VCAM-1 were treated with an isotype-matched control antibody (left photomicrographs) or with a function-blocking antibody directed against VCAM-1 (right photomicrographs). Human melanoma cells (A375) fluorescently labeled with PKH26 were allowed to adhere for 40 min to these endothelial cell cultures. Images depict low (top panels) and high magnification (bottom panels), respectively. In the upper two photomicrographs, filled arrows indicate examples of round, non-spread melanoma cells, and open arrows indicate examples of spread melanoma cells. (c) The total numbers of melanoma cells adhered to TNF-stimulated endothelial cell cultures were quantitated (left graph). In addition, the numbers of non-spread (round) and spread melanoma cells, respectively, were quantitated separately both on endothelial cells treated with isotype-matched and VCAM-directed antibodies (right graph). The values shown represent averages from 12 random microscopic fields for each condition. The experiment was repeated twice. **indicates p<0.01, ***indicates p<0.001.
Figure 2
Figure 2. Nanoscopic presentation of VCAM-1 facilitates attachment and diminishes spreading of human melanoma cells.
(a) Representative scanning electron microscopy (SEM) image of gold nanopatterns (Au-NPs) on glass (d=98 ±11nm). (b) Schematic of biofunctionalization: Via its C-terminal 6His tag, VCAM-1 is immobilized in a site-directed manner to NTA-groups bound on gold nanoparticles (Au-NPs). (c) The subsequent steps of biofunctionalization on gold were monitored by Quartz Crystal Microbalance with Dissipation (QCMD) measurements. The frequency/dissipation changes show successful conjugation of the VCAM-1-molecule. (d) Immunofluorescence image of the border-region between nanostructured and non-nanostructured areas using a fluorescent antibody directed against VCAM-1, which creates a sharply demarcated line (margin of functionalization; left photomicrograph). The clear contrast indicates immobilization of VCAM-1 on the Au-NPs and shows a low nonspecific background. The right hand phase contrast image again depicts the margin of functionalization and demonstrates that A375-melanoma cells adhere almost exclusively to the side functionalized with VCAM-1 nanopatterns but not to the pegylation side. (e) Defined gold nanoparticle matrices were bio-functionalized with VCAM-1 yielding ligand presentations at the indicated densities. The spaces between the ligand sites were passivated by (PLL-g-PEG) without RGD. Human melanoma cells adhered to these matrices for 45 min, and the matrices were then washed in a standardized fashion. (f) Melanoma cells which had firmly adhered to the matrices depicted in (e) were quantitated microscopically. The values shown represent mean numbers from 10 standardized microscopic fields (SD). *indicates p<0.05, and *** indicates p<0.001. The experiment was repeated with similar results. (g) Matrices with nanoscopically defined VCAM-1 (left), RGD motifs in-between the passivating pegylation (middle) or both (right, bifunctional matrix) were generated as detailed in Material and Methods. Representative phase-contrast photomicrographs of A375-melanoma cells on nanoscopic-VCAM-1 (65 nm) after a washing-step with PBS for 10 minutes showing attachment but no spreading on nanoscopic VCAM-1 (left, upper panel), full spreading when RGD motifs are interspersed within the pegylation (middle panel) and reduced spreading when nanosopic VCAM-1 and RGD are combined in a bifunctional matrix (right), respectively. (h) Flow cytometry histograms depicting the melanoma cell expression of integrins relevant for binding to RGD (α5β1, αVβ3) or VCAM-1 (α4β1).
Figure 3
Figure 3. VCAM-1 density determines melanoma cell plasticity.
(a) Representative phase-contrast photomicrographs of A375 (upper row) and MeWo (lower row) melanoma cells interacting with bifunctional matrices (RGD + VCAM-1) with increasing site densities of VCAM-1 (ligand site distances of 120, 90, 65 and 40 nm, respectively, corresponding to ligand site densities ranging from 70/µm2 to 670/µm2 VCAM-1-ligands). (b) A375-melanoma cells showing similar quantitative attachment independent of variations of VCAM-1 density (by one order of magnitude) next to RGD. (c) Cell spreading as determined by measuring of the cell surface areas is reduced on matrices with high densities of VCAM-1 indicating an inverse linear correlation of cell surface and VCAM-1 density. Analysis of A375-melanoma cells was performed after 1 h and cell spreading on the control matrices (RGD alone) was set to 100%. Relative to this control, tunable nanoscopic presentation significantly inhibits cell spreading in a density-dependent manner. Values shown represent the mean (± SEM) of 6 independent experiments. (p=0.0001 for RGD control vs. 670/µm2 (ligand distance: 40 nm), p=0.0243 for RGD control vs. 280/µm2 (ligand distance: 65 nm), p=0.0005 for 70/µm2 (ligand distance: 120 nm) vs. 670/µm2 (ligand distance: 65 nm), p=0.0440 for 70/µm2 (ligand distance: 120 nm) vs. 280/µm2 (ligand distance: 65 nm); global effect between 40, 65, 90 and 120 nm, respectively, was assessed using one way ANOVA, pairs were then analyzed with the two-sided Student’s t-test and subsequent Bonferroni-adjustment. *P<0.05, ***P<0.001). (d) Anti-paxillin and phalloidin were used to stain focal adhesions (green) and F-actin fibers (red), respectively. VCAM-1-densities of 70 sites per µm2 (ligand distances of 120 nm) and 120 sites per µm2 (distances of 90 nm), respectively, support stress fiber formation in contrast to ligand site densities ≥ 280/µm2 (distances ≤ 65 nm) (upper panel). Size and number of paxillin adhesions are regulated by VCAM-1-density (lower panel). (e) Statistical evaluation showing mean focal adhesion sizes of melanoma cells bound to VCAM-1 at the indicated site densities within a pegylated surface interspersed with RGD. Paxillin adhesions ranging from 0.1 to 5 µm2 were regarded as focal adhesions and analyzed morphometrically. The average size of paxillin adhesions directly correlates with increased VCAM-1 density. Values shown represent the mean (± SEM) of 4 independent experiments (p = 0.0201 for 70/µm2 vs. 670/µm2, p = 0.0111 for 120/µm2 vs. 670/µm2 and p = 0.0371 for 120/µm2 vs. 280/µm2, *P<0.05; analyzed with the two-sided Student’s t-test). (f) The number of focal adhesions (0.1 – 5 µm2) per melanoma cell bound to VCAM-1 at the indicated site densities next to RGD. The number of paxillin adhesions shows an inverse linear correlation with the densities of VCAM-1. Values shown represent the mean (± SEM) of 4 independent experiments. (p=0.0005 for 70/µm2 vs. 670/µm2, p = 0.0013 for 120/µm2 vs. 670/µm2 and p = 0.0441 for 280/µm2 vs. 670/µm2. For all statistical analysis, unpaired Bonferroni adjusted t-tests were used. * p < 0.05, ** p < 0.01, *** p < 0.001). (g) A375-melanoma cells were incubated on bifunctional matrices (RGD + VCAM-1 at the indicated site densities) for 3 hours prior to analyzing expression of RhoA, Rac-1, Cdc25 and Cyclin D1 using RT-PCR. Relative expression was determined using GAPDH for normalization. Values shown represent the mean of 3 independent experiments. (p=0.0130 for Rac-1 expression on 670 ligand sites per µm2 vs. on 70 ligand sites per µm2). (h) Human melanoma cells (A375) were incubated on bifunctional matrices (RGD + VCAM-1 at the indicated site densities) for 3 hours prior to analyzing gene expression by RT-PCR. The panels depict the results of a representative experiment (out of three experiments showing similar results). Only Rac-1 is expressed at higher levels on low-density VCAM-1 compared to high-density VCAM-1.
Figure 4
Figure 4. Melanoma cell plasticity is regulated specifically by VCAM-1/VLA-4.
(a) Specificity controls for the functional effect of VCAM-1 with regard to the inhibition of RGD-induced cell spreading were performed by modification of VCAM-1 presentation, which is depicted schematically in the upper panels (presentation of intact VCAM-1, left; enzymatic cleavage of VCAM-1 by neutrophil elastase, second from left; replacement of VCAM-1 with PECAM-1, third from left; RGD-only matrices, right). All experiments were performed on VCAM-1 ligand site distances of 65 nm. The lower panels depict representative photomicrographs from each of the indicated matrices showing that only intact VCAM-1 can inhibit RGD-induced melanoma cell spreading. (b) Melanoma cells adhered to the matriced specified in (a) for 60 min. The cell surface area was determined under each condition. Values shown represent the mean (± SEM) of 3 independent experiments (≥100 cells were analyzed per matrix/condition; p=0.0076 for VCAM-1 vs. truncated VCAM-1, p=0.0040 for VCAM-1 vs. PECAM-1 and p=0.0001 for VCAM-1 vs. RGD control. ** p<0.01, *** p<0.001, analyzed with the two-sided Student’s t-test). (c) Human A375 melanoma cells were subjected to down-regulation of the α4 integrin subunit by siRNA. The histograms depict a representative flow cytometry experiment showing integrin VLA-4 expression after treatment with control siRNA (dark grey curve), α4-directed siRNA (light grey curve) and an isotype control (open curve). (d) An average reduction of 50% in α4-expression was achieved by transfection of A375 melanoma cells with α4-directed siRNA compared to control siRNA, respectively. Values shown represent the mean (±SEM) of 4 independent experiments (** p<0.01, analyzed with the two-sided Student’s t-test.) (e) Melanoma cells transfected with α4-directed siRNA are able to spread on a RGD-containing matrix with nanoscopic VCAM-1 (left photomicrograph). In contrast, melanoma cells treated with control siRNA are inhibited in cell spreading on nanoscopic VCAM-1 (right photomicrograph). The phalloidin/DAPI fluorescence image shows impaired F-actin filament organization. (f) Statistical evaluation of cell spreading: Melanoma cells treated with control-siRNA are clearly inhibited in cell spreading compared to melanoma cells treated with α4-siRNA on nanoscopic VCAM-1 within a RGD-containing matrix (black bars, relative to the respective RGD controls). Both subpopulations (control vs. α4-knock-down cells) are able to spread on the RGD control (light grey bars). Values shown represent the mean (±SEM) of 3 independent experiments. (p=0.0278 for control siRNA transfected cells vs. α4 siRNA knock down cells, p=0.0092 for control siRNA transfected melanoma cells on RGD+VCAM-1 vs. RGD-only presentation, Student’s two-tailed, unpaired t-test).
Figure 5
Figure 5. Pulmonary VCAM-1 expression in vivo is associated with morphogenesis of melanoma cells.
(a) Murine B16F10 melanoma cells stably transfected with GFP were analyzed for expression of VLA-4, the ligand of VCAM-1, by flow cytometry. (b) C57BL6 mice were left untreated (light gray bars) or treated by intra-tracheal instillation of MALP-2. After 24 h. the mice were injected intravenously with 106 GFP-labeled B16F10 melanoma cells. The lungs of the mice were harvested after 1, 5 or 30 min (n=3 mice per group) and snap-frozen in liquid nitrogen. GFP-labeled melanoma cells as well as VCAM-1-expressing pulmonary blood vessels were analyzed in cryostat-cut sections by fluorescence microscopy. The left graph depicts the average numbers of VCAM-1-expressing pulmonary blood vessels indicating induction by MALP-2. The middle and the right graphs depict the total numbers of melanoma cells and melanoma cells adjacent to VCAM-1-expressing blood vessels, respectively. Values shown represent mean counts from 41 microscopic fields (±SD). ***indicates p<0.001. (c) Representative examples of cryostat-cut sections showing areas with GFP-expressing melanoma cells (green) adjacent to (filled arrows) or distant from (open arrows) VCAM-1-expressing pulmonary blood vessels (red).
Figure 6
Figure 6. Endothelial VCAM-1 tips the balance in melanoma cell plasticity.
The schematic illustrates the cellular consequences following modulation of the VCAM-1 density in a putative (micro)environment that is permissive for cell spreading. At low densities of VCAM-1, RGD moieties facilitate spreading of melanoma cells. This morphological phenotype is also characterized by numerous immature focal adhesions and delicate F-actin fibers. High densities of VCAM-1, in contrast, force the cell into a globular shape with fewer but mature focal adhesions and prominent F-actin stress fibers. This “morphogenic dictate” of VCAM-1 overrules the still-present signals by RGD moieties.

References

    1. Ott PA, Hodi FS, Robert C. CTLA-4 and PD-1/PD-L1 blockade: new immunotherapeutic modalities with durable clinical benefit in melanoma patients. Clin Cancer Res. 2013;19:5300–5309. - PubMed
    1. Robert C, Karaszewska B, Schachter J, Rutkowski P, Mackiewicz A, Stroiakovski D, Lichinitser M, Dummer R, Grange F, Mortier L, et al. Improved overall survival in melanoma with combined dabrafenib and trametinib. N Engl J Med. 2015;372:30–39. - PubMed
    1. Robert C, Long GV, Brady B, Dutriaux C, Maio M, Mortier L, Hassel JC, Rutkowski P, McNeil C, Kalinka-Warzocha E, et al. Nivolumab in previously untreated melanoma without BRAF mutation. N Engl J Med. 2015;372:320–330. - PubMed
    1. Hamid O, Robert C, Daud A, Hodi FS, Hwu WJ, Kefford R, Wolchok JD, Hersey P, Joseph RW, Weber JS, et al. Safety and tumor responses with lambrolizumab (anti-PD-1) in melanoma. N Engl J Med. 2013;369:134–144. - PMC - PubMed
    1. Wolchok JD, Kluger H, Callahan MK, Postow MA, Rizvi NA, Lesokhin AM, Segal NH, Ariyan CE, Gordon RA, Reed K, et al. Nivolumab plus ipilimumab in advanced melanoma. N Engl J Med. 2013;369:122–133. - PMC - PubMed

Publication types