

Ca2+ releases E-Syt1 autoinhibition to couple ER-plasma membrane tethering with lipid transport
- PMID: 29222176
- PMCID: PMC5770786
- DOI: 10.15252/embj.201797359
Ca2+ releases E-Syt1 autoinhibition to couple ER-plasma membrane tethering with lipid transport
Abstract
The extended synaptotagmins (E-Syts) are endoplasmic reticulum (ER) proteins that bind the plasma membrane (PM) via C2 domains and transport lipids between them via SMP domains. E-Syt1 tethers and transports lipids in a Ca2+-dependent manner, but the role of Ca2+ in this regulation is unclear. Of the five C2 domains of E-Syt1, only C2A and C2C contain Ca2+-binding sites. Using liposome-based assays, we show that Ca2+ binding to C2C promotes E-Syt1-mediated membrane tethering by releasing an inhibition that prevents C2E from interacting with PI(4,5)P2-rich membranes, as previously suggested by studies in semi-permeabilized cells. Importantly, Ca2+ binding to C2A enables lipid transport by releasing a charge-based autoinhibitory interaction between this domain and the SMP domain. Supporting these results, E-Syt1 constructs defective in Ca2+ binding in either C2A or C2C failed to rescue two defects in PM lipid homeostasis observed in E-Syts KO cells, delayed diacylglycerol clearance from the PM and impaired Ca2+-triggered phosphatidylserine scrambling. Thus, a main effect of Ca2+ on E-Syt1 is to reverse an autoinhibited state and to couple membrane tethering with lipid transport.
Keywords: C2 domain; SMP domain; extended synaptotagmin; lipid transfer; phosphatidylserine scrambling.
© 2017 The Authors.
Figures

- A
Domain structures of E‐Syts (left) and E‐Syt1 constructs (right) used for the liposome tethering assays shown in the figure. Slanted white lines indicate the mutations in the Ca2+ binding sites in C2A and C2C domains.
- B–D
Liposome aggregation, due to tethering of anchoring and target liposomes in the presence of E‐Syt1 constructs (protein:lipid ratio 1:1,000) at RT, as assessed by increase in turbidity (OD 405 nm). Time‐courses are at left, and bar graphs showing quantification of OD405 increases at the end of the incubation (arrows in the left panel) are at right. (B) Effect of the lipid composition and C2E on liposome tethering by E‐Syt1cyto in the absence of Ca2+. A cocktail of EGTA, imidazole, and proteinase K (Cocktail) was added after 10 min. (C) Effect of the absence or presence of Ca2+ on liposome tethering by E‐Syt1cyto with or without mutations in the Ca2+‐binding sites in C2A and C2C. (D) Effect of the absence or presence of Ca2+ and of PI(4,5)P2 in the target liposomes on liposome tethering by E‐Syt1cyto lacking the C2E domain. Mean and SD of three independent experiments. P‐values from t‐test with Bonferroni corrections are quoted on the graphs. ****P < 0.0001; n.s., not significant.

- A
Domain structures of E‐Syt1 constructs used for the liposomes tethering assays shown in (B and C). Asterisks indicate the mutations in the membrane binding surface of C2A domain.
- B, C
Tethering of anchoring and target liposomes in the presence of E‐Syt1 constructs at RT as assessed by increase in turbidity (OD 405 nm). In each of the panels, time‐courses are at left and bar graphs showing quantification of OD405 increases at the end of the incubation (arrows in the left panels) are at right. (B) Effect of the absence or presence of Ca2+ on liposome tethering by SMP‐C2AxBCD, SMP‐C2ABCxD, and SMP‐C2AmBCxD. Mean and SD of three independent experiments. P‐values from t‐test with Bonferroni corrections are quoted on the graphs. ****P < 0.0001; n.s. not significant. (C) Liposome tethering by E‐Syt1cyto with or without C2ABCD domains in the absence of Ca2+. Mean and SD of three independent experiments. P‐values from two‐tailed Student's t‐test are quoted on the graphs. ***P < 0.001.
- D
SMP‐C2ABCxD and SMP‐C2AxBCD bind to liposomes in a Ca2+‐dependent manner, as revealed by liposome tethering. OD405 readings were normalized to the maximum value. Mean and SD of three independent experiments.
- E
Left: Purified C2CD and C2E were incubated in the presence of the cross‐linker BS3 and in the absence or presence of Ca2+ and liposomes. The left lane shows molecular weight markers, with sizes indicated in kilodaltons. The cross‐linked heterodimer, as confrmed by mass spectrometry, is indicated by the red arrowhead. Right: Normalized intensity of cross‐linked heterodimer was plotted. Mean and SD of three independent experiments. P‐values from t‐test with Bonferroni corrections are quoted on the graphs. **P < 0.01; n.s., not significant.
- F
Sequence of C2CD and C2E used for cross‐linking assay. The peptides identified by mass spectrometry are highlighted in red.

- A
Domain structures of constructs used for the lipid transfer assays shown in the figure. PH = PH domain of rat PLCδ. Slanted white lines indicate the mutations in the Ca2+ binding sites in C2A and C2C domains. Asterisks indicate the mutations in the membrane binding surface of C2A domain.
- B
Left: Time‐course of normalized fluorescence signals of liposomes mixtures containing 1.5% NBD‐PE in the donor liposomes in the absence or presence of Ca2+ at RT. E‐Syt1 constructs were added at time 0 (protein:lipid ratio 1:1,000). Right: Quantification of the increase in NBD fluorescence at the end of the incubation (arrow in left).
- C–E
Lipid transfer between donor and acceptor liposomes in the presence of E‐Syt1 constructs (protein:lipid ratio 1:400) at 37°C as assessed by dequenching of NBD‐PE fluorescence. In each of the panels, time‐courses are at the top and bargraphs showing quantification of NBD fluorescence at the end of the incubation (arrows in the upper panels) are at the bottom. (C) Effect of C2ABCDE‐dependent liposome tethering on lipid transfer mediated by the SMP domain. (D) Effect of the Ca2+‐binding property of C2A on the lipid transfer activity of the SMP domain between C2ABCDE‐tethered liposomes. (E) Effect of Ca2+ on the lipid transfer activity of the SMP domain alone or SMP‐C2AB on liposomes tethered by a PH domain.

- A, B
Tethering of anchoring and target liposomes in the presence of the constructs indicated (see Fig 4A, protein:lipid ratio 1:400) at 37°C as assessed by increase in turbidity (OD 405 nm). In each of the panels, time‐courses are at left and bar graphs showing quantification of OD405 increases at the end of the incubation (arrows in the left panels) are at right. (A) Effect of the absence or presence of Ca2+ on liposome tethering by SMP or C2ABCDE. Mean and SD of three independent experiments. P‐values from t‐test with Bonferroni corrections are quoted on the graphs. ****P < 0.0001; n.s. not significant. (B) Effect of the absence or presence of Ca2+ on liposome tethering by PHPLCδ. Mean and SD of three independent experiments. P‐values from two‐tailed student's t‐test are quoted on the graphs. n.s. not significant.

Lipid transfer between donor and acceptor liposomes in the presence of E‐Syt1 constructs (see Fig 4A, protein:lipid ratio 1:1,000) at RT as assessed by dequenching of NBD‐PE fluorescence. Time‐courses are at left, and bar graphs showing quantification of NBD fluorescence at the end of the incubation (arrow in the left panel) are at right.
E‐Syt1cyto and SMP‐C2AB were added to the mixture of anchoring and target liposomes (protein:lipid ratio 1:1,000) in the absence or presence of Ca2+. Time‐courses are at left, and bar graphs showing quantification of OD405 increases at the end of the incubation (arrow in the left panel) are at right.

- A
Ribbon representation of the crystal structure of the SMP‐C2AB of human E‐Syt2 dimer in different orientations (PDB code 2DMG). One monomer is shown in regular color and the other in pale colors. The SMP domain is in yellow and the C2AB domain pairs in red. Lipid molecules are represented as stick in dark orange.
- B
Left: Intramolecular interface between the SMP domain and the C2A domain. Right: Intermolecular interface between SMP domain and C2A domain.
- C, D
Lipid transfer between donor and acceptor liposomes in the presence of E‐Syt1 constructs (protein:lipid ratio 1:400) at 37°C as assessed by dequenching of NBD‐PE fluorescence. In each of the panels, time‐courses are at left and bar graphs showing quantification of NBD fluorescence at the end of the incubation (arrows in the left panels) are at right. (C) Effect of mutations in the SMP domain at either its intramolecular or intermolecular interface. (D) Effect of the salt concentration on the lipid transfer activity of SMP or SMP‐C2AB on liposomes tethered by a PH domain. Mean and SD of three independent experiments. P‐values from t‐test with Bonferroni corrections are quoted on the graphs. *P < 0.05; **P < 0.01; n.s., not significant.
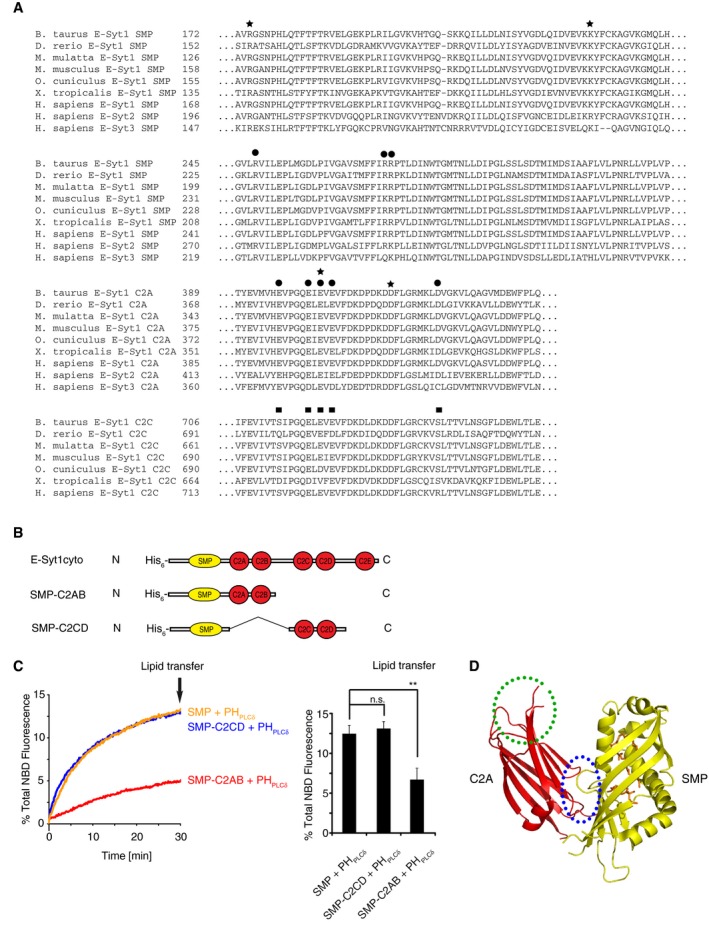
Sequence alignment of the three E‐Syts from various species showing conserved amino acid residues implicated in intramolecular (black circles) and intermolecular (black stars) interfaces between the SMP domain and C2A domains in the crystal structure of E‐Syt2. The residues of C2C corresponding to the residues of C2A involved in the SMP‐C2A interaction are indicated by black squares. Note that these residues are not highly conserved.
Domain structures of E‐Syt1 used for the lipid transfer assays shown in (C).
Impact of the C2AB domain pair, but not of the C2CD domain pair, on lipid transfer mediated by the indicated proteins between PHPLCδ ‐tethered donor and acceptor liposomes as determined by dequenching of NBD‐PE in donor liposomes at 37°C. Time‐courses are shown at left, and bar graphs showing quantification of % total NBD fluorescence at the end of the incubation (arrow in the left panel) are shown at right. Mean and SD of three independent experiments. P‐values from t‐test with Bonferroni corrections are quoted on the graphs. **P < 0.01; n.s., not significant.
C2A binds Ca2+ and the SMP domain via different surfaces. The intramolecular interface between the SMP domain (yellow) and C2A domain (red) of E‐Syt2 is indicated by a blue dashed circle. The Ca2+‐binding surface of C2A is indicated by a green dashed circle. Lipid molecules are shown in orange.

Time‐course of normalized mCherry signal at the PM of WT and E‐Syts TKO cells expressing the DAG reporter C1PKC‐mCherry, as assessed by TIRF microscopy, in response to the indicated compounds.
Quantification of F/F0 at the end of the experiment (arrow in A).

TIRF microscopy images of E‐Syts TKO cells expressing WT or C2Ax mutant EGFP‐E‐Syt1, together with the DAG probe C1PKC‐mCherry, and exposed to the indicated compounds at the indicated time. Note loss of mCherry signal in response to ionomycin in cells expressing WT E‐Syt1. Scale bars, 10 μm.
Upper: Time‐course of normalized EGFP signal at the PM of E‐Syts TKO cells expressing the WT or EGFP‐E‐Syt1 C2Ax, as assessed by TIRF microscopy, in response to the indicated compounds. Bottom: Quantification of F/F0 at 9.5 min (arrow in the upper panel). Mean and SEM, n = 22 cells (EGFP‐E‐Syt1), n = 11 cells (EGFP‐E‐Syt1 C2Ax), n = 10 cells (EGFP‐E‐Syt1 C2Cx); P‐values from t‐test with Bonferroni corrections are quoted on the graphs. n.s., not significant; ****P < 0.0001.
Confocal images of E‐Syts TKO cells expressing the indicated constructs before and during stimulation with 2 μM ionomycin as indicated. Scale bars, 10 μm.
Left: Time‐course of normalized mCherry signal at the PM of E‐Syts TKO cells expressing the DAG reporter C1PKC‐mCherry, as assessed by TIRF microscopy, in response to the indicated compounds. Right: Quantification of F/F0 at the end of the experiment (arrow in the left panel). Mean and SEM, n = 31 cells (TKO + EGFP‐E‐Syt1), n = 35 cells (TKO + EGFP‐E‐Syt1 C2Ax), n = 18 cells (TKO + EGFP‐E‐Syt1 C2Am); P‐values from t‐test with Bonferroni corrections are quoted on the graphs. n.s., not significant; ****P < 0.0001.

- A, B
Confocal images of WT (A) and E‐Syt1/2 double KO (DKO) cells (B) before and 15 min after stimulation with 2 μM ionomycin. PS scrambling was detected with confocal microscopy by the binding to the cell surface of Cy3‐labeled annexin V (annexin V‐Cy3) present in the medium. Scale bars, 10 μm.
- C
Domain structures of E‐Syt1 constructs used for the rescue experiments.
- D–F
Normalized cell surface‐associated annexin V‐Cy3 fluorescence in response to 2 μM ionomycin, as assessed by confocal microscopy, for WT and E‐Syt1/2/3 triple KO (TKO) cells with and without rescue with transfected E‐Syt1 constructs. Time‐courses are at left, and bar graphs showing quantification of F/F0 at the time point (arrow in the left panels) are at right. (D) PS scrambling within the time frame indicated is abolished in E‐Syts TKO cells, and rescued by expression of EGFP‐E‐Syt1 alone or EGFP‐E‐Syt1 together with Myc‐E‐Syt2, but not by expression of EGFP‐E‐Syt1 ∆SMP [mean and SEM, n = 20 cells (WT), n = 20 cells (TKO), n = 16 cells (TKO + EGFP‐E‐Syt1 + Myc‐E‐Syt2), n = 24 cells (TKO + EGFP‐E‐Syt1), n = 17 cells (TKO + EGFP‐E‐Syt1 ∆SMP); P‐values from t‐test with Bonferroni corrections are quoted on the graphs. n.s., not significant; ****P < 0.0001]. (E) Defective rescue of PS scrambling in E‐Syts TKO cells transfected with EGFP‐E‐Syt1 carrying SMP domain mutations as indicated [mean and SEM, n = 20 cells (TKO), n = 24 cells (TKO + EGFP‐E‐Syt1), n = 20 cells (TKO + EGFP‐E‐Syt1 V169W/L308W); P‐values from t‐test with Bonferroni corrections are quoted on the graphs. n.s., not significant; ****P < 0.0001]. (F) Defective rescue of PS scrambling in E‐Syts TKO cells transfected with E‐Syt1 harboring Ca2+‐binding mutations in C2A or C2C [mean and SEM, n = 10 cells (TKO), n = 18 cells (TKO + EGFP‐E‐Syt1), n = 15 cells (TKO + EGFP‐E‐Syt1 C2Ax), n = 18 cells (TKO + EGFP‐E‐Syt1 C2Cx); P‐values from t‐test with Bonferroni corrections are quoted on the graphs. n.s., not significant; ****P < 0.0001].

- A–D
Confocal images of WT (A and C) and E‐Syt1/2 DKO (B and D) cells incubated with FITC‐labeled annexin V (annexin V‐FITC, A and B) and expressing Lact‐C2‐mCherry (C and D) before and during stimulation with 2 μM ionomycin as indicated. Note the progressive accumulation of annexin V‐FITC signals (A) and decrease in Lact‐C2‐mCherry signals (C, insets) at the PM of WT cells, but not of DKO cells (B and D). Scale bars, 10 μm.
- E
Left: Time‐course of normalized Lact‐C2‐mCherry fluorescence, as assessed by confocal microscopy, in response to 2 μm ionomycin, from WT and E‐Syt1/2 DKO cells. For overexpression and rescue experiments, WT and E‐Syts DKO cells were transfected with EGFP‐E‐Syt1 together with Myc‐E‐Syt2 as indicated. Right: Quantification of F/F0 at the end of the experiment (arrow in the left panel). Mean and SEM, n = 13 cells (WT), n = 13 cells (WT + EGFP‐E‐Syt1&Myc‐E‐Syt2), n = 16 cells (DKO), n = 10 cells (DKO + EGFP‐E‐Syt1&Myc‐E‐Syt2); P‐values from t‐test with Bonferroni corrections are quoted on the graphs. n.s., not significant; ****P < 0.0001.
- F
Confocal images of E‐Syt1/2 double KO (DKO) cells expressing the indicated constructs before and during stimulation with 2 μM ionomycin at the indicated time. PS scrambling was detected with confocal microscopy by the binding to the cell surface of annexin V‐Cy3 present in the medium. Note that the two EGFP‐E‐Syt1 constructs are recruited to the PM in response to Ca2+. Scale bars, 10 μm.
- G
Time‐course of normalized annexin V‐Cy3 fluorescence, as assessed by confocal microscopy, in response to 2 μm ionomycin, from WT and E‐Syt1/2 DKO cells. For overexpression and rescue experiments, WT and E‐Syts DKO cells were transfected with either EGFP‐E‐Syt1 together with Myc‐E‐Syt2, or EGFP‐E‐Syt1 alone, or EGFP‐E‐Syt1 ΔSMP as indicated. Mean and SEM (quantification in H).
- H
Quantification of F/F0 at the end of the experiment (arrow in G). Mean and SEM, n = 8 cells (WT), n = 12 cells (WT + EGFP‐E‐Syt1&Myc‐E‐Syt2), n = 14 cells (WT + EGFP‐E‐Syt1), n = 11 cells (DKO), n = 13 cells (DKO + EGFP‐E‐Syt1&Myc‐E‐Syt2), n = 15 cells (DKO + EGFP‐E‐Syt1), n = 13 cells (DKO + EGFP‐E‐Syt1 ΔSMP); P‐values from t‐test with Bonferroni corrections are quoted on the graphs. n.s., not significant; **P < 0.01, ****P < 0.0001.
- I
Rescue with C2 domain Ca2+‐binding‐deficient mutants of E‐Syt1. Overexpression and rescue with C2C domain mutant and C2A domain mutant are shown. Quantification of annexin V‐Cy3 F/F0 at the end of the experiment similar to (G). Mean and SEM, n = 13 cells (WT), n = 11 cells (WT + EGFP‐E‐Syt1 C2Ax), n = 15 cells (WT + EGFP‐E‐Syt1 C2Cx), n = 12 cells (DKO), n = 10 cells (DKO + EGFP‐E‐Syt1), n = 15 cells (DKO + EGFP‐E‐Syt1_C2Ax), n = 12 cells (DKO + EGFP‐E‐Syt1 C2Cx); P‐values from t‐test with Bonferroni corrections are quoted on the graphs. n.s., not significant; ***P < 0.001.
- J
Detection of PM lipid scrambling with FM1‐43. Time‐courses of normalized FM1‐43 fluorescence, as assessed by confocal microscopy, from WT, E‐Syt DKO, and E‐Syt TKO cells, are on the left. Bar graphs showing quantification of F/F0 at the end of the experiment (arrow in left panel) are on the right. Mean and SEM, n = 34 cells (WT), n = 28 cells (TKO), n = 24 cells (DKO); P‐values from t‐test with Bonferroni corrections are quoted on the graphs. ****P < 0.0001.

References
-
- Alva V, Lupas AN (2016) The TULIP superfamily of eukaryotic lipid‐binding proteins as a mediator of lipid sensing and transport. Biochem Biophys Acta 1861: 913–923 - PubMed
-
- Brown KL, Conboy JC (2013) Lipid flip‐flop in binary membranes composed of phosphatidylserine and phosphatidylcholine. J Phys Chem B 117: 15041–15050 - PubMed
-
- Chang CL, Hsieh TS, Yang TT, Rothberg KG, Azizoglu DB, Volk E, Liao JC, Liou J (2013) Feedback regulation of receptor‐induced Ca2+ signaling mediated by E‐Syt1 and Nir2 at endoplasmic reticulum‐plasma membrane junctions. Cell Rep 5: 813–825 - PubMed
Publication types
MeSH terms
Substances
Grants and funding
LinkOut - more resources
Full Text Sources
Other Literature Sources
Research Materials
Miscellaneous
