. 2018 Jan 24;38(4):918-936.
doi: 10.1523/JNEUROSCI.1305-17.2017. Epub 2017 Dec 8.

Common Pathophysiology in Multiple Mouse Models of Pitt-Hopkins Syndrome

Affiliations

Common Pathophysiology in Multiple Mouse Models of Pitt-Hopkins Syndrome

Courtney Thaxton et al. J Neurosci. .

Abstract

Mutations or deletions of the transcription factor TCF4 are linked to Pitt-Hopkins syndrome (PTHS) and schizophrenia, suggesting that the precise pathogenic mutations dictate cellular, synaptic, and behavioral consequences. Here, we generated two novel mouse models of PTHS, one that mimics the most common pathogenic TCF4 point mutation (human R580W, mouse R579W) and one that deletes three pathogenic arginines, and explored phenotypes of these lines alongside models of pan-cellular or CNS-specific heterozygous Tcf4 disruption. We used mice of both sexes to show that impaired Tcf4 function results in consistent microcephaly, hyperactivity, reduced anxiety, and deficient spatial learning. All four PTHS mouse models demonstrated exaggerated hippocampal long-term potentiation (LTP), consistent with deficits in hippocampus-mediated behaviors. We further examined R579W mutant mice and mice with pan-cellular Tcf4 heterozygosity and found that they exhibited hippocampal NMDA receptor hyperfunction, which likely drives the enhanced LTP. Together, our data pinpoint convergent neurobiological features in PTHS mouse models and provide a foundation for preclinical studies and a rationale for testing whether NMDAR antagonists might be used to treat PTHS.SIGNIFICANCE STATEMENT Pitt-Hopkins syndrome (PTHS) is a rare neurodevelopmental disorder associated with TCF4 mutations/deletions. Despite this genetic insight, there is a need to identify the function of TCF4 in the brain. Toward this goal, we developed two mouse lines, including one harboring the most prevalent pathogenic point mutation, and compared them with two existing models that conditionally delete Tcf4 Our data identify a set of overlapping phenotypes that may serve as outcome measures for preclinical studies of PTHS treatments. We also discovered penetrant enhanced synaptic plasticity across mouse models that may be linked to increased NMDA receptor function. These data reveal convergent neurobiological characteristics of PTHS mouse models and support the further investigation of NMDA receptor antagonists as a possible PTHS treatment.

Keywords: NMDA; Pitt–Hopkins syndrome; TCF4; autism; mouse; schizophrenia.


Figures

Figure 1.
Figure 1.
Generation and validation of PTHS model mice that express a dominant-negative form of TCF4. A, Several mutation sites (pink text) within the bHLH region (exon 18, yellow) are associated with PTHS. We generated mice with a pathogenic point mutation (Tcf4R579W; R579W) or a unique in-frame deletion that removes three of five pathogenic arginines associated with PTHS (Tcf4Δ574–579; ▵574–579). The table lists mouse models and abbreviations used in this study. B, Electropherograms showing heterozygosity of the mutations: a c.1735A>T transition in the R579W mice and a c.1120_1137del frameshift mutation in the ▵574–579 mice. C, Transcriptional activity measured by luciferase assays of wild-type TCF4 and pathogenic point mutations. D, Transcriptional activity of wild-type TCF4 compared with the R579W and ▵574–579 variants. E, Transcriptional activity of TCF4, the transcriptional activator ASCL1, R579W, or ▵574–579 constructs (orange hash) either alone or in combination as indicated. Data represent mean ± SEM. Post hoc unpaired t tests with Bonferroni correction: ***p ≤ 0.001, ****p ≤ 0.0001.
Figure 2.
Figure 2.
PTHS model mice have reduced body and brain weight. AD, Body and brain weights of adult (P70–P90) control littermates compared with R579W mice (A), cHet mice (B), CNS-cHet mice (C), and ▵574–579 mice (D). Data represent individual data points and mean ± SEM. *p ≤ 0.05, **p ≤ 0.01, ****p ≤ 0.0001. E, Representative NeuroTrace- (Nissl-), DAPI-, and merged stained coronal sections of adult control littermates compared with R579W mice, cHet, and ▵574–579 mice. Scale bar, 2 mm.
Figure 3.
Figure 3.
TCF4 mutant mice are hyperactive and show reduced anxiety. Behavioral data from the open-field (AC) and elevated plus maze (DF) tasks. A, Distance traveled in an open field plotted in 5 min intervals. B, Total distance traveled in the open field over a 1 h testing period. C, Center time in an open field plotted in 5 min intervals. D, Time spent in either the closed or open arms of an elevated plus maze. E, Percentage of time spent in the open arms. F, Total number of entries made into either the closed or open arms. Data represent mean ± SEM and individual data points are plotted when feasible. Protected Fisher's LSD tests following significant ANOVA effects (A, C, D, F) or unpaired two-sample t tests (B, E): *p ≤ 0.05, **p ≤ 0.01, ***p ≤ 0.001, ****p ≤ 0.0001.
Figure 4.
Figure 4.
TCF4 mutant mice have an impaired startle response. Mice were tested for auditory function, reactivity to environmental stimuli, and sensorimotor gating by the acoustic startle test at 7–12 weeks of age (A, B) and 16–19 weeks of age (C, D). A, Response to acoustic startle (AS: 120 dB) alone or in combination with a prepulse sound level (74, 78, 82, 86, or 90 dB). B, Percentage of prepulse inhibition (PPI). C, D, Startle amplitude (C) and %PPI (D) upon retest at 16–19 weeks of age. Note that only one cohort of data from R579W mice and controls is shown for the second acoustic startle test at 16 weeks. Data represent individual data points and mean ± SEM. Protected Fisher's LSD tests following significant ANOVA effects: *p ≤ 0.05, **p ≤ 0.01, ****p ≤ 0.0001.
Figure 5.
Figure 5.
TCF4 mutant mice have typical motor coordination and social behavior. A, Latency to fall on an accelerating rotarod. B, Amount of time the mice spent in either the empty chamber or the chamber housing a novel mouse (Novel 1) in a three-chambered assay. C, Number of entries made into the empty versus occupied (Novel 1) chamber in the three-chambered assay. D, Time spent with either a now familiar (Novel 1) or a new mouse (Novel 2) in a three-chambered assay. E, Number of entries that each mouse made into the chamber housing either a now familiar mouse (Novel 1) or a novel mouse (Novel 2) in a three-chambered assay. Only data from the male R579W mice and control are presented for the three-chambered task due to high variability in the female mice. Data represent individual data points and mean ± SEM. Protected Fisher's LSD tests following significant ANOVA effects: *p ≤ 0.05, **p ≤ 0.01, ***p ≤ 0.001, ****p ≤ 0.0001.
Figure 6.
Figure 6.
PTHS model mice exhibit hippocampus-dependent spatial learning and memory deficits. A, Latency to find a hidden platform during training in the Morris water maze task. B, Distance traveled during hidden platform training. C, Latency to find a hidden platform in a reversal learning task in which the platform is placed in a new location. D, Distance traveled during reversal learning task. Insets in AD represent the combined data for the first 3 d from 2 cohorts of R579W and control mice. Data represent mean ± SEM. Protected Fisher's LSD tests following significant ANOVA effects: *p ≤ 0.05, **p ≤ 0.01, ***p ≤ 0.001, ****p ≤ 0.0001.
Figure 7.
Figure 7.
Synaptic transmission and short-term plasticity are normal in PTHS mouse models. Extracellular field recordings from hippocampal area CA1 and evoked by Schaffer collateral stimulation. (A) I/O curves for R579W (A1), cHet (A2), CNS-cHet (A3), and Δ574–579 (A4) mice relative to control littermates. Insets in A show representative responses during generation of I/O characteristics. (B), Fiber volley responses for R579W (B1), cHet (B2), CNS-cHet (B3), and Δ574–579 (B4) mice relative to control littermates. (C) Paired-pulse ratio (PP2/PP1) for R579W (C1), cHet (C2), CNS-cHet (C3), and Δ574–579 (C4) mice relative to control littermates. Insets in C show representative paired-pulse responses with a 60 ms interpulse interval. Scale bar, 5 ms 0.25 mV.
Figure 8.
Figure 8.
Consistent enhancement of hippocampal LTP in PTHS model mice. (A) LTP of fEPSP slope induced by 3, 1 s bursts at 100 Hz separated by 20 Hz for R579W (A1), cHet (A2), CNS-cHet (A3), and Δ574–579 (A4) mice relative to control littermates. Top, Representative traces scale bars, 5 ms 0.25 mV. (B) LTD of fEPSP slope induced by 1 Hz stimulation for 15 min for R579W (B1), cHet (B2), CNS-cHet (B3), and Δ574–579 (B4) mice relative to control littermates. Representative trace scale bars: 5 ms 0.25 mV. (C) Frequency-response curves generated across a range of stimulation frequencies for R579W (C1), cHet (C2), CNS-cHet (C3), and Δ574–579 (C4) mice relative to control littermates. Data show mean ± SEM. *p < 0.05.
Figure 9.
Figure 9.
The R579W mutation alters active membrane properties in CA1 pyramidal neurons. Current-clamp measurements from CA1 pyramidal cells from R579W mice and control littermates of passive properties (AD) and intrinsic excitability and action potential features (EI). A, RMP. B, Averaged input resistance. Sample trace scale bars: 500 ms × 10 mV. C, Sag ratio. Sample trace (150 pA injection) scale bars, 250 ms × 10 mV. D, Rebound slope. Left, Representative rebound slope examples based on rebound/steady-state voltage relationship. E, Membrane time constant τm measured from hyperpolarizing (−400 pA) or depolarizing (+400 pA) current steps. F, Action potential firing rate to a depolarizing (200 pA) current step. Sample trace scale bar, 250 ms × 25 mV. G, Firing threshold. Left, Example action potentials. Scale bar, 20 ms × 25 mV. Right, Membrane voltage at which action potentials are initiated (dVm/dt = 20). HJ, Maximum action potential dVm/dt (H), height (I), and half-width (J). Error bars: mean ± SEM. p ≤ 0.05. Post hoc unpaired two-sample t tests with Bonferroni correction (BD, F) or unpaired two-sample t tests (A, E, G, HJ): *p ≤ 0.05. **p ≤ 0.005. ***p ≤ 0.005.
Figure 10.
Figure 10.
Active membrane properties in CA1 pyramidal neurons are largely unaffected by heterozygous deletion of Tcf4. Shown are current-clamp measurements from CA1 pyramidal cells from cHet mice and control littermates of intrinsic excitability and action potential features. A, Action potential firing rate to a depolarizing (200 pA) current step. Sample trace scale bar, 250 ms × 25 mV. B, Firing threshold. Left, Example action potentials. Scale bar, 20 ms × 25 mV. Right, Membrane voltage at which action potentials (APs) are initiated. CE, Maximum AP dVm/dt (C), height (D), and half-width (E). Error bars indicate mean ± SEM.
Figure 11.
Figure 11.
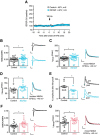
The R579W and cHet mutations result in hippocampal NMDA receptor hyperfunction. A, The NMDAR antagonist D, L-APV (50 μm) blocked LTP induced by 3 × 1 s 100 Hz bursts and measured in fEPSPs in hippocampal area CA1 in R579W mice and controls. B, NMDAR-mediated current to AMPAR-mediated current ratio (NMDA/AMPA) in R579W mice and controls. Sample traces represent AMPA majority (−70 mV) and NMDA majority (+40 mV). Scale bars, 100 ms × 100 pA. C, Decay time constants (τdecay) measured at +40 mV of NMDAR majority currents in R579W mice and controls. Amplitude-normalized traces are shown with scale bar, 100 ms. D, Decay time constants (τdecay) in R579W mice and controls measured from pharmacologically isolated NMDAR-mediated currents (shaded indicates DNQX). Amplitude normalized traces are shown with scale bar, 100 ms. E, Sensitivity of NMDAR-mediated currents to the NR2B subunit-selective antagonist ifenprodil (5 μm) in R579W mice and controls. F, NMDA/AMPA ratio in cHet mice and controls. Sample traces represent AMPA-majority (−70 mV) and NMDA-majority (+40 mV). Scale bars, 100 ms × 100 pA. G, Decay time constants (τdecay) measured at +40 mV of NMDAR-majority currents cHet mice and controls. Amplitude normalized traces are shown with scale bar, 100 ms. Error bars indicate mean ± SEM *p ≤ 0.05.

Similar articles

Cited by

References

    1. Amiel J, Rio M, de Pontual L, Redon R, Malan V, Boddaert N, Plouin P, Carter NP, Lyonnet S, Munnich A, Colleaux L (2007) Mutations in TCF4, encoding a class I basic helix-loop-helix transcription factor, are responsible for Pitt–Hopkins syndrome, a severe epileptic encephalopathy associated with autonomic dysfunction. Am J Hum Genet 80:988–993. 10.1086/515582 - DOI - PMC - PubMed
    1. Balogh SA, McDowell CS, Stavnezer AJ, Denenberg VH (1999) A behavioral and neuroanatomical assessment of an inbred substrain of 129 mice with behavioral comparisons to C57BL/6J mice. Brain Res 836:38–48. 10.1016/S0006-8993(99)01586-3 - DOI - PubMed
    1. Bannerman DM, Rawlins JN, McHugh SB, Deacon RM, Yee BK, Bast T, Zhang WN, Pothuizen HH, Feldon J (2004) Regional dissociations within the hippocampus–memory and anxiety. Neurosci Biobehav Rev 28:273–283. 10.1016/j.neubiorev.2004.03.004 - DOI - PubMed
    1. Bast T, Feldon J (2003) Hippocampal modulation of sensorimotor processes. Prog Neurobiol 70:319–345. 10.1016/S0301-0082(03)00112-6 - DOI - PubMed
    1. Bergqvist I, Eriksson M, Saarikettu J, Eriksson B, Corneliussen B, Grundström T, Holmberg D (2000) The basic helix-loop-helix transcription factor E2–2 is involved in T lymphocyte development. Eur J Immunol 30:2857–2863. 10.1002/1521-4141(200010)30:10%3C2857::AID-IMMU2857%3E3.0.CO;2-G - DOI - PubMed

Publication types

MeSH terms

Substances

Supplementary concepts