. 2017 Dec 8;8(1):2009.
doi: 10.1038/s41467-017-02221-9.

Brain insulin resistance impairs hippocampal synaptic plasticity and memory by increasing GluA1 palmitoylation through FoxO3a

Affiliations

Brain insulin resistance impairs hippocampal synaptic plasticity and memory by increasing GluA1 palmitoylation through FoxO3a

Matteo Spinelli et al. Nat Commun. .

Abstract

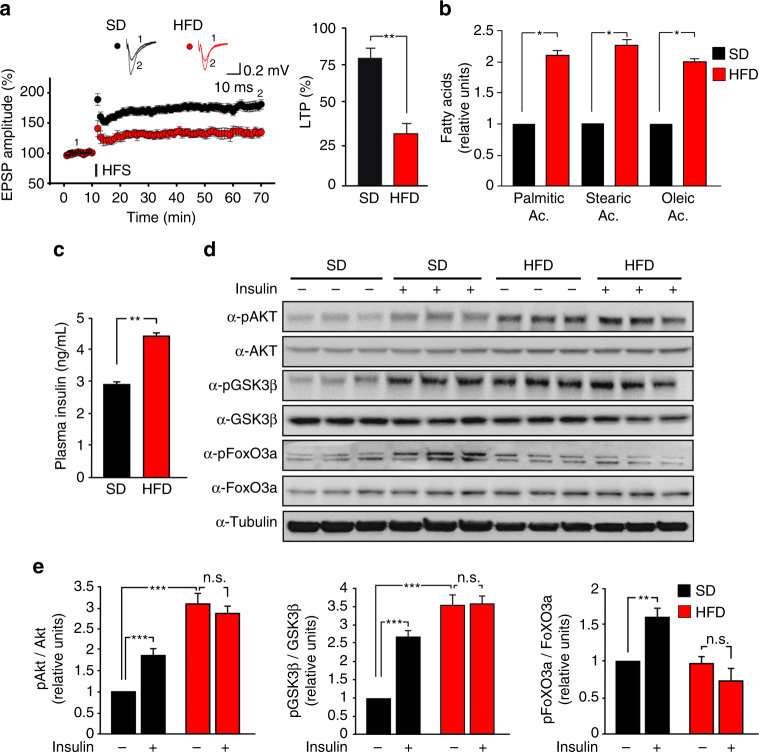
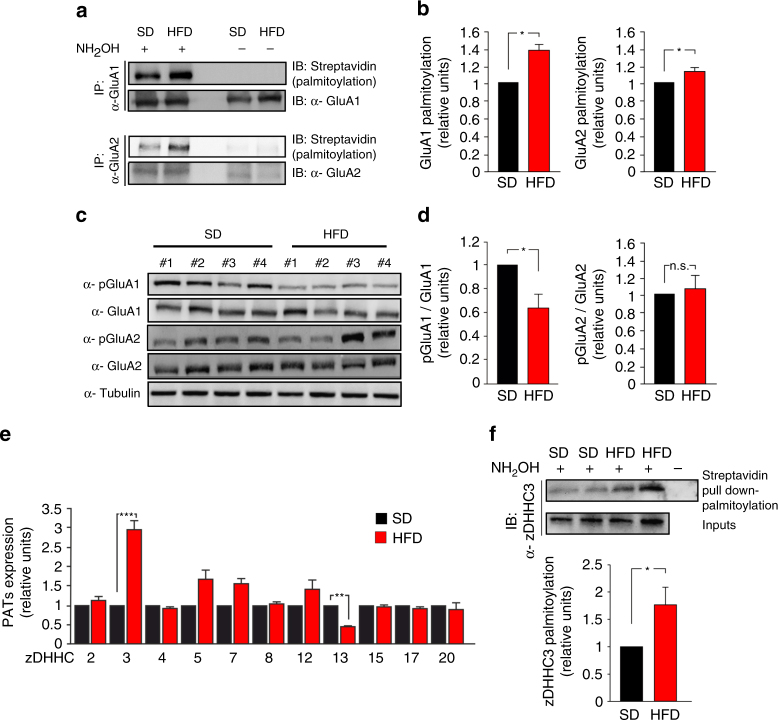
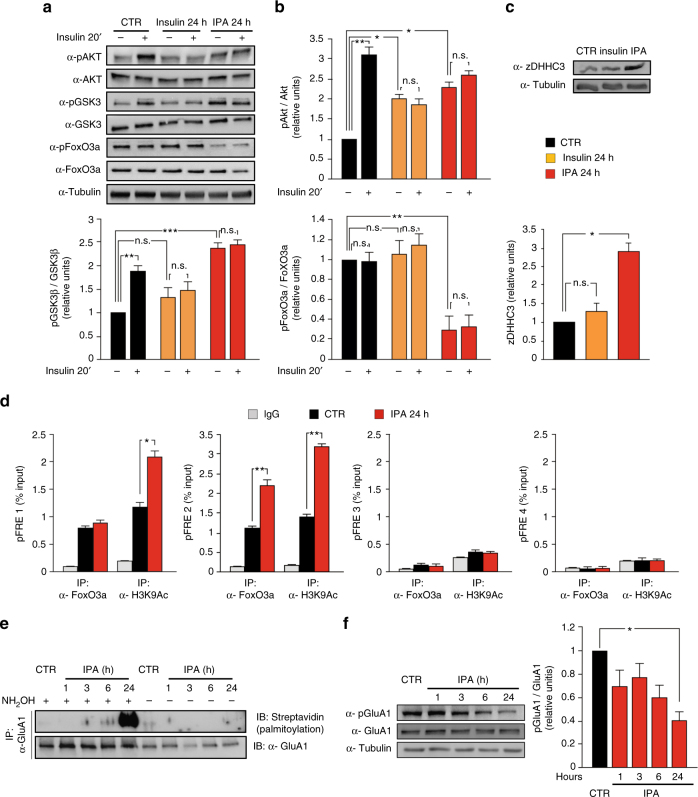
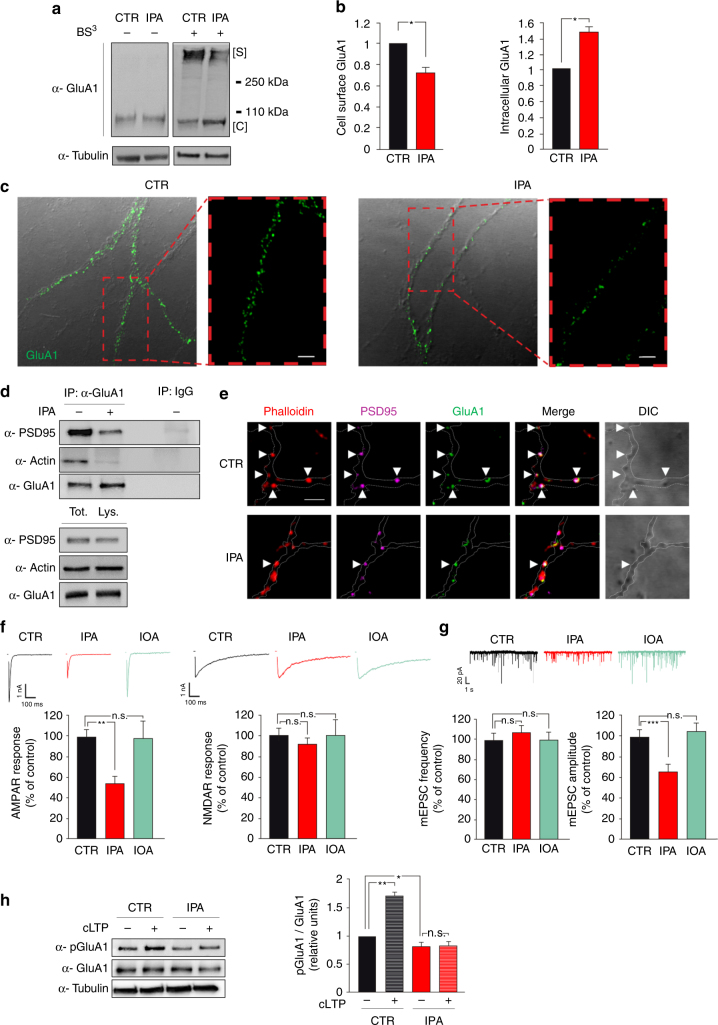
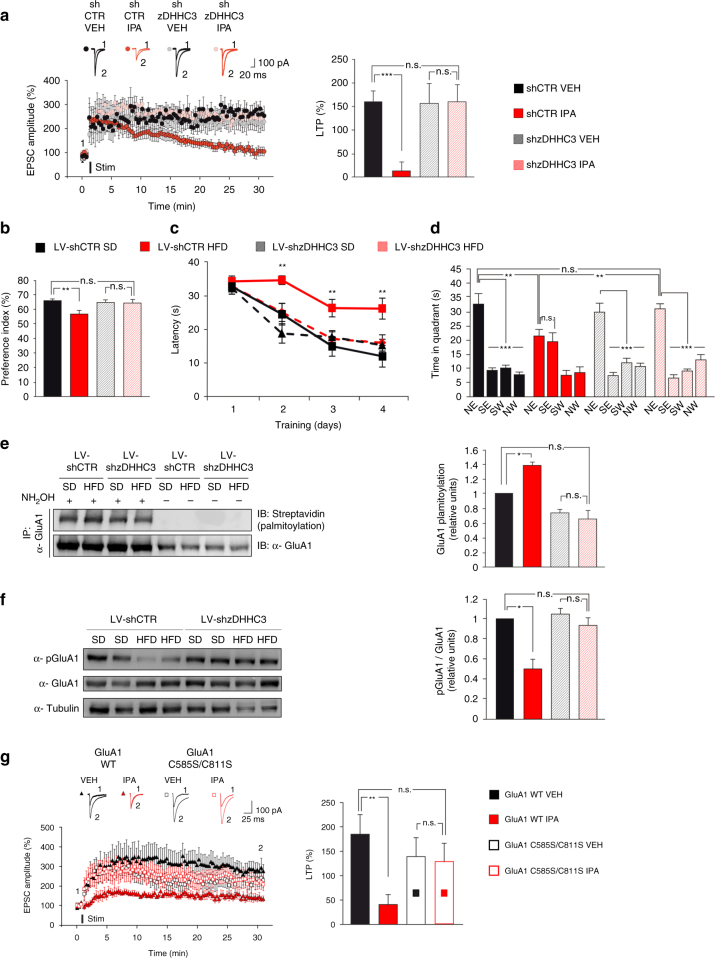
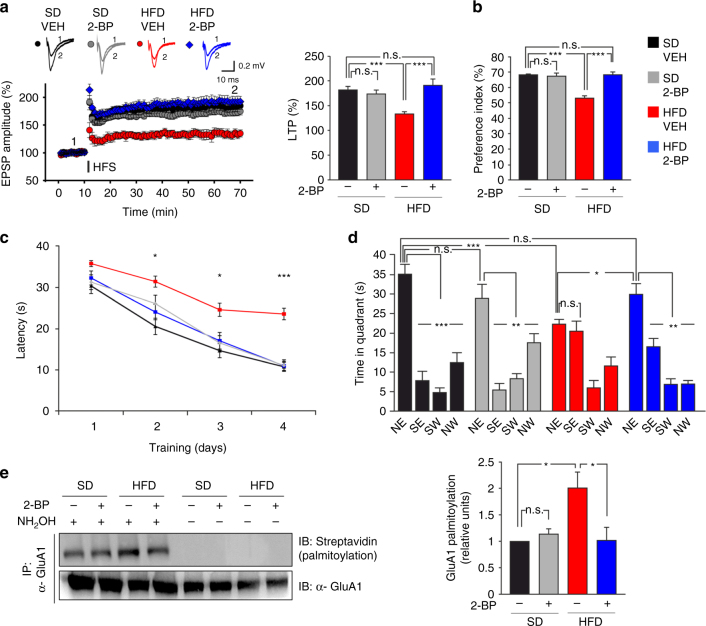
High-fat diet (HFD) and metabolic diseases cause detrimental effects on hippocampal synaptic plasticity, learning, and memory through molecular mechanisms still poorly understood. Here, we demonstrate that HFD increases palmitic acid deposition in the hippocampus and induces hippocampal insulin resistance leading to FoxO3a-mediated overexpression of the palmitoyltransferase zDHHC3. The excess of palmitic acid along with higher zDHHC3 levels causes hyper-palmitoylation of AMPA glutamate receptor subunit GluA1, hindering its activity-dependent trafficking to the plasma membrane. Accordingly, AMPAR current amplitudes and, more importantly, their potentiation underlying synaptic plasticity were inhibited, as well as hippocampal-dependent memory. Hippocampus-specific silencing of Zdhhc3 and, interestingly enough, intranasal injection of the palmitoyltransferase inhibitor, 2-bromopalmitate, counteract GluA1 hyper-palmitoylation and restore synaptic plasticity and memory in HFD mice. Our data reveal a key role of FoxO3a/Zdhhc3/GluA1 axis in the HFD-dependent impairment of cognitive function and identify a novel mechanism underlying the cross talk between metabolic and cognitive disorders.


Conflict of interest statement

The authors declare no competing financial interests.

Figures

Fig. 1
Fig. 1
HFD impairs synaptic plasticity, induces insulin resistance, and increases palmitic acid levels in the hippocampus. a Time course of LTP at CA3-CA1 synapses induced by HFS delivered at time 10 (line) in hippocampal slices obtained from mice fed with SD (n = 12 slices) or HFD (n = 9 slices) for 6 weeks. Results are expressed as percentages of baseline fEPSP amplitude (=100%). Insets show representative fEPSPs at baseline (1) and during the last 5 min of LTP recording (2). Traces are averages of five consecutive responses at the time points indicated with 1 and 2. On right, bar graphs of LTP observed during the last 5 min in SD and HFD mice (statistics by unpaired Student’s t-test). b Relative amounts of fatty acid (measured by GC-FID analysis) extracted from hippocampi of SD (n = 9) and HFD (n = 8) mice (statistics by unpaired Student’s t-test). c Insulin plasma levels of SD and HFD mice measured by ELISA performed in duplicate (n = 10 mice per group; statistics by unpaired Student’s t-test). d Immunoblot analysis revealing increased phosphorylation of Akt Ser473 and GSK3β Ser9 and abolished responsiveness to insulin injection in the hippocampi of HFD mice. Samples were harvested from two independent experiments. e Densitometry of phospho-proteins (shown in d) normalized to both the corresponding total protein and tubulin (n = 6 per group; statistics by two-way ANOVA and Bonferroni post hoc). Data are expressed as mean ± standard error of the mean (SEM). *p < 0.05; ** p < 0.01; ***p < 0.001; n.s. not significant. See also Supplementary Fig. 1
Fig. 2
Fig. 2
HFD increases palmitoylation and inhibits phosphorylation of GluA1. a Palmitoylation of GluA1 and GluA2 was examined in the hippocampus of SD and HFD mice using a modified biotin switch assay (ABE, see "Acyl-biotinyl exchange assay" section in Methods). Immunoblot showing palmitoylated (acyl-biotinyl exchanged and detected by streptavidin) GluR (top) and total immunoprecipitated protein (bottom). Samples without NH2OH are negative controls. b Densitometry of palmitoylated GluA1/total immunoprecipitated GluA1 (left, n = 6) and palmitoylated GluA2/total immunoprecipitated GluA2 ratio (right, n = 4; statistics by Mann–Whitney test). c Immunoblots of hippocampal homogenates revealing reduced phosphorylation of GluA1 at serine 845 (pGluA1 Ser845) in HFD mice, and unchanged phosphorylation of GluA2 at serine 880 (pGluA2 Ser880). Samples were harvested from two independent experiments. d Densitometry of pGluA1 Ser845 (left) and pGluA2 Ser880 (right) blots normalized to both the corresponding total protein and tubulin (n = 10 mice per group; statistics by unpaired Student’s t-test). e Expression of zDHHC 2, 3, 4, 5, 7, 8, 12, 13, 15, 17, and 20 mRNA, assessed by Real-Time qPCR. Gene expression was normalized to actin. Data represent mean values obtained from five mice for each group; experiments were performed in triplicate (statistics by unpaired Student’s t-test). f Immunoblots showing palmitoylation (Streptavidin pull down-palmitoylation also named “proteomic ABE”, see Methods) (top) and expression (middle) of zDHHC3 in the hippocampus of SD and HFD mice. Samples without NH2OH are negative controls. Densitometry (bottom) of palmitoylated zDHHC3/total protein (n = 6; statistics by Mann–Whitney test). Data are expressed as mean ± s.e.m. *p < 0.05; **p < 0.01; n.s. not significant. See also Supplementary Fig. 2
Fig. 3
Fig. 3
Insulin and palmitic acid (IPA) transcriptionally induce zDHHC3 and affect palmitoylation and phosphorylation of GluA1 in hippocampal neurons. a Immunoblots of pGSK3β Ser9 and pFoxO3a Ser253 after 24 h of insulin or IPA treatment and upon acute stimulation with insulin. b Densitometry of pAkt Ser473 (top), pGSK3β Ser9 (bottom, left), and pFoxO3a Ser253 (bottom, right) blots, normalized to both the corresponding total protein and tubulin; experiments were performed in triplicate (statistics by two-way ANOVA and Bonferroni post hoc). c Immunoblots (top) and densitometry (bottom) of zDHHC3 expression after insulin or IPA treatment; experiments were performed in triplicate (statistics by one-way ANOVA and Bonferroni post hoc). d Chromatin immunoprecipitation assays of FoxO3a binding to and histone H3 lysine 9 acetylation (H3K9Ac) of putative FoxO3a responsive elements (pFRE) around the zDHHC3 promoter in hippocampal neurons treated with vehicle (CTR) or IPA (statistics by Mann–Whitney test). Data represent mean values of three independent experiments. e Immunoblots of palmitoylated GluA1 (top) and total immunoprecipitated protein (bottom) in hippocampal neurons. Samples without NH2OH are negative controls. The experiment was repeated three times with similar results. f Immunoblots of pGluA1 Ser845 (left) and densitometry of pGluA1 Ser845 normalized to both total GluA1 and tubulin (right). The experiment was repeated three times (n = 3, statistics by one-way ANOVA and Bonferroni post hoc). Data are shown as mean ± SEM.*p < 0.05; **p < 0.01; ***p < 0.001; n.s. not significant
Fig. 4
Fig. 4
IPA affects synaptic localization of GluA1 and AMPA currents in hippocampal neurons. a Immunoblots of control (–) and BS3 cross-linked (+) surface exposed receptors upon treatment with vehicle (CTR) or IPA showing cytoplasmic GluA1 monomers (C) and surface subunit tetramers including GluA1 (S). b Densitometry of both cell surface (left) and intracellular (right) GluA1 fractions normalized to tubulin; the experiment was repeated six times (statistics by Mann–Whitney test). c Immunofluorescence analysis of surface GluA1 in hippocampal neurons. A magnification is shown in the box (right); scale bar = 5 μm. d Immunoblots of GluA1 interaction with both PSD95 (top) and actin (middle). On bottom, cell lysates probed with α-PSD95, α-actin, and α-GluA1. The experiment was repeated four times. e Confocal images of immunofluorescence double staining of neurites upon IPA treatment. PSD95 (fuchsia) and GluA1 (green) immunoreactivity are merged. Neurites are visualized by phalloidin staining and differential interference contrast image (DIC). Arrows show dendritic spines exhibiting co-localization of GluA1 and PSD95; scale bar = 10 μm. f Representative traces (top) and bar graphs showing mean AMPAR (bottom, left) and NMDAR currents (bottom, right) in autaptic neurons exposed to vehicle (CTR), IPA, or insulin and oleic acid (IOA); recordings for AMPAR currents: n = 21 per each group (statistics by one-way ANOVA and Student–Newman–Keuls post hoc). g Representative traces (top) and bar graphs showing mean mEPSC frequency (bottom, left) and amplitude (bottom, right) in autaptic neurons; mEPSC recordings: n = 21 controls, n = 20 IPA, n = 20 IOA (statistics by one-way ANOVA and Student–Newman–Keuls post hoc). h Immunoblots and densitometry of chemical LTP-dependent pGluA1 Ser845 in hippocampal neurons. Experiment was repeated four times (statistics by two-way ANOVA and Bonferroni post hoc). Data are shown as mean ± SEM *p < 0.05; **p < 0.01; ***p < 0.001; n.s. not significant. See also Supplementary Fig. 3
Fig. 5
Fig. 5
Hippocampal silencing of zDHHC3 abolishes HFD-dependent learning and memory impairment. a Time course (left) of LTP at CA3-CA1 synapses in hippocampal organotypic slices transfected with plasmid-encoding for control shRNA or zDHHC3 shRNA and treated with vehicle (VEH) or IPA for 24 h. Results are expressed as percentages of baseline EPSC amplitude (=100%). Insets (top) show representative EPSC at baseline (1) and during the last 5 min of LTP recording (2). On right, mean LTP values during the last 5 min (n = 7 for each group; statistics by two-way ANOVA and Bonferroni post hoc). b Preference for the novel object of mice fed SD or HFD and injected with lentiviral particles harboring control shRNA (LV-shCTR) or shRNA against zDHHC3 (LV-shzDHHC3) (n = 9 for each group; statistics by two-way ANOVA and Bonferroni post hoc). c Latency to reach the platform (n = 9 for each group; significance is indicated for LV-shCTRHFD vs. all other groups; statistics by two-way ANOVA and Bonferroni post hoc). d Time spent in the four quadrants during probe test. NE is the target quadrant (n = 9 for each group; statistics by two-way ANOVA and Bonferroni post hoc). e Palmitoylated GluA1 (left, top) and total immunoprecipitated protein (left, bottom) in hippocampi. Densitometry (right) of palmitoylated GluA1/total immunoprecipitated GluA1 ratio (n = 3 per each group; statistics by two-way ANOVA and Bonferroni post hoc). f Immunoblots of pGluA1 Ser845 and densitometry of pGluA1 Ser845 normalized to both the total GluA1 and tubulin (n = 5 mice per group; statistics by two-way ANOVA and Bonferroni post hoc). g Time course (left) of LTP at CA3-CA1 synapses in hippocampal organotypic slices transfected with plasmids encoding for GluA1 WT or GluA1 C585S/C811S. Results are expressed as percentages of baseline EPSC amplitude (=100%). Insets (top) show representative EPSC at baseline (1) and during the last 5 min of LTP recording (2). On right, mean LTP values during the last 5 min (n = 12 for each group; statistics by two-way ANOVA and Bonferroni post hoc). Data are expressed as mean ± SEM *p < 0.05; **p < 0.01; ***p < 0.001; n.s. not significant. See also Supplementary Fig. 4
Fig. 6
Fig. 6
2-BP reverts GluA1 palmitoylation and rescues both synaptic plasticity impairment and memory loss induced by HFD. a Time course (left) of LTP at CA3-CA1 synapses induced by HFS delivered at time 10 (line) in hippocampal slices of mice fed with SD or HFD for 6 weeks and intranasally injected with vehicle or 2-BP (SDVEH, SD2-BP, HFDVEH, HFD2-BP; n = 12 slices per each group). Results are expressed as percentages of baseline EPSP amplitude (=100%). Insets (top) show representative EPSPs at baseline (1) and during the last 5 min of LTP recording (2). On right, LTP recorded during the last 5 min (statistics by two-way ANOVA and Bonferroni post hoc). b Preference for the novel object in NOR paradigm (n = 9 for each group; statistics by two-way ANOVA and Bonferroni post hoc). c Latency to reach the hidden platform in MWM test (n = 9 for each group; significance is indicated between SDVEH or HFD2-BP and HFDVEH mice; statistics by two-way ANOVA and Bonferroni post hoc). d Time spent in the four quadrants during probe test of MWM test. NE is the target quadrant (n = 9 for each group; statistics by two-way ANOVA and Bonferroni post hoc). e Immunoblots (left) of palmitoylated GluA1 (top) and total immunoprecipitated protein (bottom) in hippocampi of SD and HFD mice. On right, densitometry of palmitoylated GluA1/total immunoprecipitated GluA1 amount ratio (n = 4; statistics by two-way ANOVA and Bonferroni post hoc). Data are expressed as mean ± SEM *p < 0.05; **p < 0.01; ***p < 0.001; n.s. not significant. See also Supplementary Fig. 5

References

    1. Buffington SA, Huang W, Costa-Mattioli M. Translational control in synaptic plasticity and cognitive dysfunction. Annu. Rev. Neurosci. 2014;37:17–38. doi: 10.1146/annurev-neuro-071013-014100. - DOI - PMC - PubMed
    1. Zito K, Svoboda K. Activity-dependent synaptogenesis in the adult Mammalian cortex. Neuron. 2002;35:1015–1017. doi: 10.1016/S0896-6273(02)00903-0. - DOI - PubMed
    1. Lomo T. Frequency potentiation of excitatory synaptic activity in the dentate area of the hippocampal formation. Acta Physiol. Scand. 1966;68:128.
    1. Rebola N, Srikumar BN, Mulle C. Activity-dependent synaptic plasticity of NMDA receptors. J. Physiol. 2010;588:93–9. doi: 10.1113/jphysiol.2009.179382. - DOI - PMC - PubMed
    1. Soderling TR, Derkach VA. Postsynaptic protein phosphorylation and LTP. Trends Neurosci. 2000;23:75–80. doi: 10.1016/S0166-2236(99)01490-3. - DOI - PubMed

Publication types