. 2017 Dec 8;7(1):17193.
doi: 10.1038/s41598-017-17370-6.

The Transcriptomic Signature Of Disease Development And Progression Of Nonalcoholic Fatty Liver Disease

Affiliations

The Transcriptomic Signature Of Disease Development And Progression Of Nonalcoholic Fatty Liver Disease

Sophie Cazanave et al. Sci Rep. .

Erratum in

Abstract

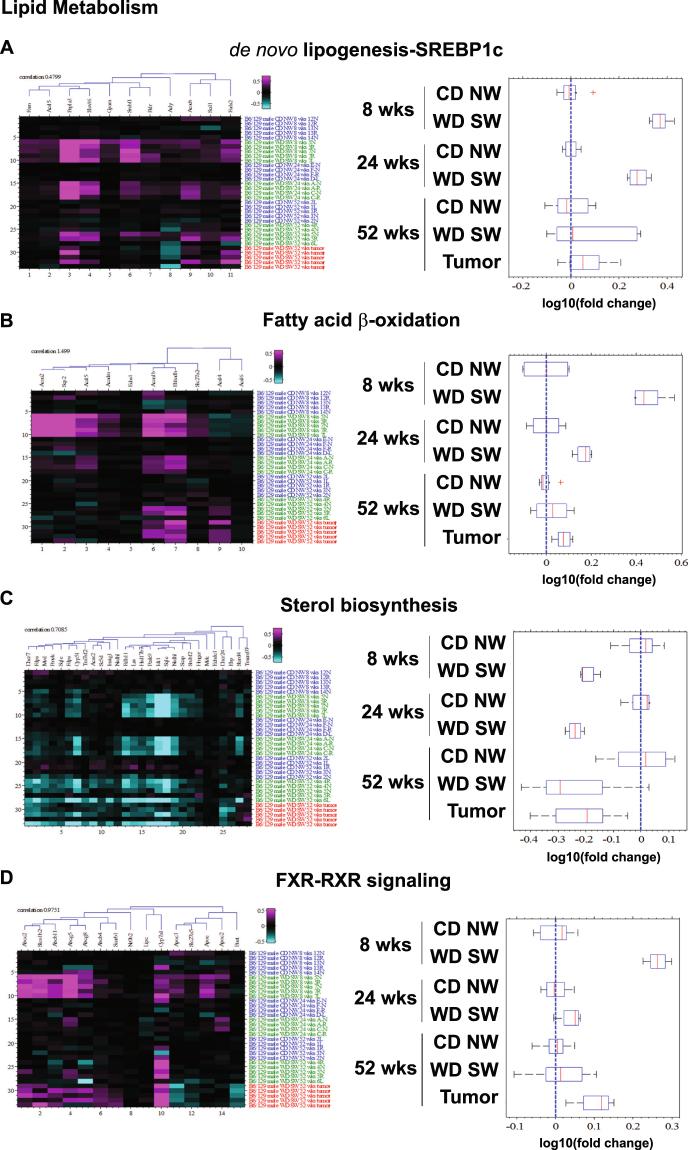
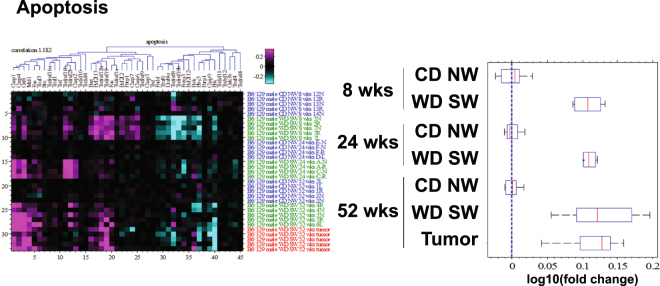
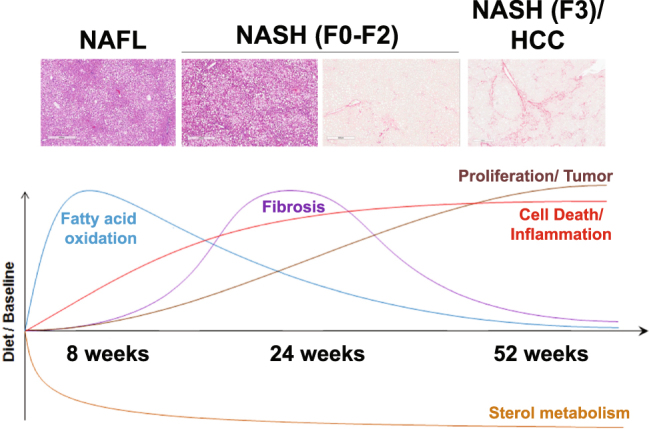
A longitudinal molecular model of the development and progression of nonalcoholic fatty liver disease (NAFLD) over time is lacking. We have recently validated a high fat/sugar water-induced animal (an isogenic strain of C57BL/6 J:129S1/SvImJ mice) model of NAFLD that closely mimics most aspects of human disease. The hepatic transcriptome of such mice with fatty liver (8 weeks), steatohepatitis with early fibrosis (16-24 weeks) and advanced fibrosis (52 weeks) after initiation of the diet was evaluated and compared to mice on chow diet. Fatty liver development was associated with transcriptional activation of lipogenesis, FXR-RXR, PPAR-α mediated lipid oxidation and oxidative stress pathways. With progression to steatohepatitis, metabolic pathway activation persisted with additional activation of IL-1/inhibition of RXR, granulocyte diapedesis/adhesion, Fc macrophage activation, prothrombin activation and hepatic stellate cell activation. Progression to advanced fibrosis was associated with dampening of metabolic, oxidative stress and cell stress related pathway activation but with further Fc macrophage activation, cell death and turnover and activation of cancer-related networks. The molecular progression of NAFLD involves a metabolic perturbation which triggers subsequent cell stress and inflammation driving cell death and turnover. Over time, inflammation and fibrogenic pathways become dominant while in advanced disease an inflammatory-oncogenic profile dominates.


Conflict of interest statement

Dr. Sanyal is the founder of the company Sanyal Biotechnology that performs pre-clinical drug-testing using the DIAMOND model.

Figures

Figure 1
Figure 1
Changes in metabolic pathways. Heat maps resulting from hierarchical clustering and box plots with averages for genes implicated in (A) de novo lipogenesis (11 genes averaged), (B) Fatty acid β-oxidation (8 genes averaged), (C) Sterol biosynthesis (22 genes averaged) or (D) FXR-RXR signaling (14 genes averaged) pathways with a fold-change greater than ±1.5 from WD SW liver samples as compared to CD NW at 8, 24 and 52 weeks or from liver tumors at 52 weeks as compared to WD SW 52 weeks with a false discovery rate (FDR) <0.1. Boxes show 25th and 75th percentile, whiskers show 5th and 95th percentile, red line is the median average score, and blue dash line shows no change compared with CD NW at 8, 24 and 52 weeks or compared to WD SW 52 weeks for liver tumors.
Figure 2
Figure 2
Changes in cell stress-related pathways. Heat maps resulting from hierarchical clustering and box plots with averages for genes implicated in (A) Peroxisome (30 genes averaged), (B) Nrf2-mediated oxidative stress (37 genes averaged), (C) Proteasome (48 genes averaged), (D) Mitochondrial dysfunctions (28 genes averaged), (E) Unfolded protein response (15 genes averaged) and (F) Autophagy (6 genes averaged) signaling pathways with a fold-change greater than ±1.5 from WD SW liver samples as compared to CD NW at 8, 24 and 52 weeks or from liver tumors at 52 weeks as compared to WD SW 52 weeks with a false discovery rate (FDR) <0.1. Boxes show 25th and 75th percentile, whiskers show 5th and 95th percentile, red line is the median average score, and blue dash line shows no change compared with CD NW at 8, 24 and 52 weeks or compared to WD SW 52 weeks for liver tumors.
Figure 3
Figure 3
Changes in apoptosis pathways. Heat maps resulting from hierarchical clustering and box plots with averages for genes implicated in apoptosis pathways (25 genes averaged) with a fold-change greater than ±1.5 from WD SW liver samples as compared to CD NW at 8, 24 and 52 weeks or from liver tumors at 52 weeks as compared to WD SW 52 weeks with a false discovery rate (FDR) <0.1. Boxes show 25th and 75th percentile, whiskers show 5th and 95th percentile, red line is the median average score, and blue dash line shows no change compared with CD NW at 8, 24 and 52 weeks or compared to WD SW 52 weeks for liver tumors.
Figure 4
Figure 4
Changes in inflammatory pathways. Heat maps resulting from hierarchical clustering and box plots with averages for genes implicated in (A) TLR signaling (12 genes averaged), (B) Fcgr-mediated phagocytosis (18 genes averaged), (C) INFγ signaling (58 genes averaged), (D) Inflammasome (4 genes averaged) pathways with a fold-change greater than ±1.5 from WD SW liver samples as compared to CD NW at 8, 24 and 52 weeks or from liver tumors at 52 weeks as compared to WD SW 52 weeks with a false discovery rate (FDR) <0.1. Boxes show 25th and 75th percentile, whiskers show 5th and 95th percentile, red line is the median average score, and blue dash line shows no change compared with CD NW at 8, 24 and 52 weeks or compared to WD SW 52 weeks for liver tumors.
Figure 5
Figure 5
Changes in fibrosis pathways. Heat maps resulting from hierarchical clustering and box plots with averages for genes implicated in fibrosis pathways (26 genes averaged) with a fold-change greater than ±1.5 from WD SW liver samples as compared to CD NW at 8, 24 and 52 weeks or from liver tumors at 52 weeks as compared to WD SW 52 weeks with a false discovery rate (FDR) <0.1. Boxes show 25th and 75th percentile, whiskers show 5th and 95th percentile, red line is the median average score, and blue dash line shows no change compared with CD NW at 8, 24 and 52 weeks or compared to WD SW 52 weeks for liver tumors.
Figure 6
Figure 6
Changes in cell proliferation and oncogenic pathways. Heat maps resulting from hierarchical clustering and box plots with averages for genes implicated in (A) Proliferation (41 genes averaged), (B) Cancer pathways (51 genes averaged), (C) TGFβ signaling (2 genes averaged), (D) Wnt-β catenin (3 genes averaged) pathways with a fold-change greater than ±1.5 from WD SW liver samples as compared to CD NW at 8, 24 and 52 weeks or from liver tumors at 52 weeks as compared to WD SW 52 weeks with a false discovery rate (FDR) <0.1. Boxes show 25th and 75th percentile, whiskers show 5th and 95th percentile, red line is the median average score, and blue dash line shows no change compared with CD NW at 8, 24 and 52 weeks or compared to WD SW 52 weeks for liver tumors.
Figure 7
Figure 7
The molecular progression of NAFLD. First, a metabolic perturbation which triggers subsequent cell stress and inflammation driving cell death and turnover. Over time, inflammation and fibrogenic pathways become dominant while in advanced disease an inflammatory-oncogenic profile dominates. Upper part of the figure: Representative images of liver histology from DIAMOND mice at 8 (NAFL), 24 (Stage 0–2 fibrosis) and 52 weeks (Stage 3 fibrosis with HCC) (H&E or Sirius Red; original magnification, ×10).

Similar articles

Cited by

References

    1. Loomba R, Sanyal AJ. The global NAFLD epidemic. Nat. Rev. Gastroenterol. Hepatol. 2013;10:686–690. doi: 10.1038/nrgastro.2013.171. - DOI - PubMed
    1. Pais R, et al. A systematic review of follow-up biopsies reveals disease progression in patients with non-alcoholic fatty liver. Journal of Hepatology. 2013;59:550–556. doi: 10.1016/j.jhep.2013.04.027. - DOI - PubMed
    1. Schattenberg JM, Schuppan D. Nonalcoholic steatohepatitis: the therapeutic challenge of a global epidemic. Curr. Opin. Lipidol. 2011;22:479–88. doi: 10.1097/MOL.0b013e32834c7cfc. - DOI - PubMed
    1. Pacana T, Sanyal AJ. Recent advances in understanding/management of non-alcoholic steatohepatitis. F1000Prime Rep. 2015;7:28. doi: 10.12703/P7-28. - DOI - PMC - PubMed
    1. Peverill W, Powell LW, Skoien R. Evolving concepts in the pathogenesis of NASH: Beyond steatosis and inflammation. International Journal of Molecular Sciences. 2014;15:8591–8638. doi: 10.3390/ijms15058591. - DOI - PMC - PubMed

Publication types