

Neocortical origin and progression of gray matter atrophy in nonamnestic Alzheimer's disease
- PMID: 29223682
- PMCID: PMC5801003
- DOI: 10.1016/j.neurobiolaging.2017.11.008
Neocortical origin and progression of gray matter atrophy in nonamnestic Alzheimer's disease
Abstract
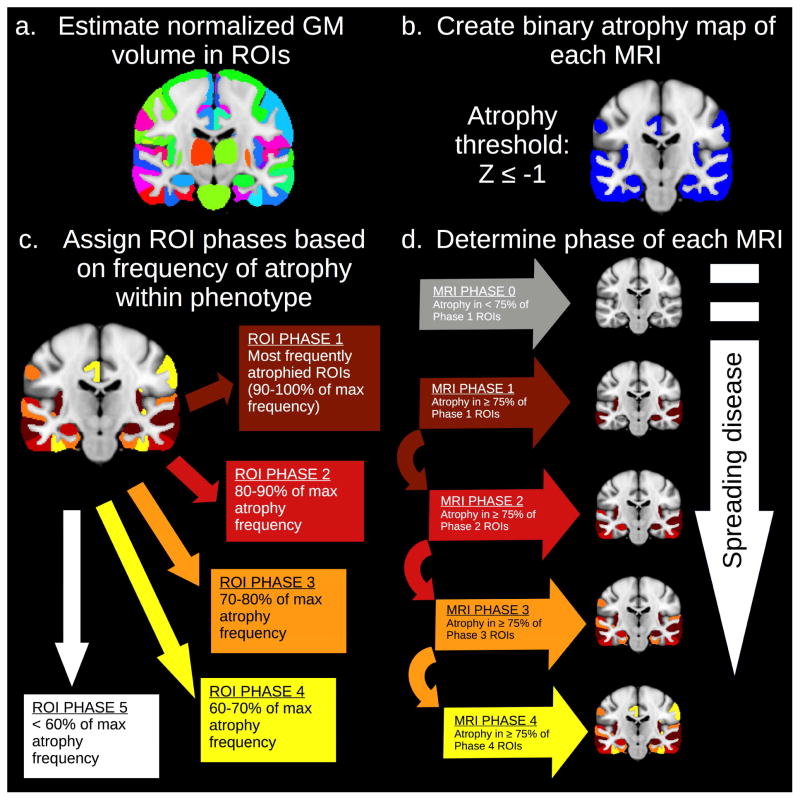
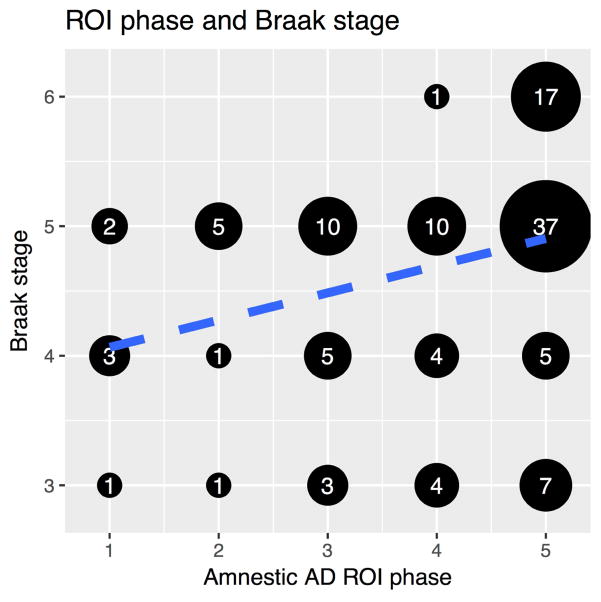
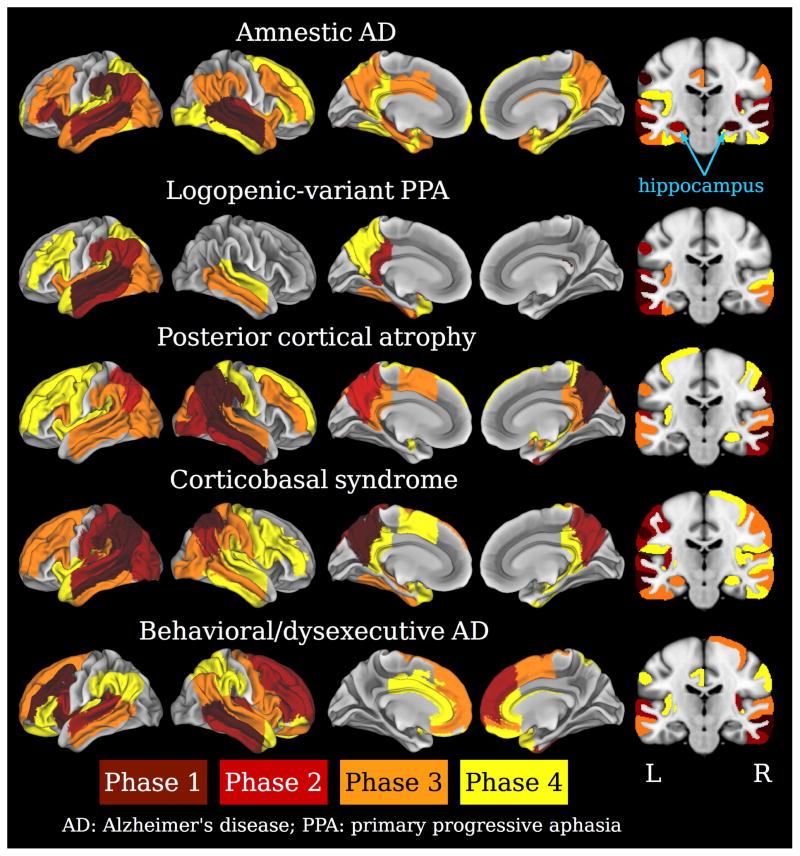
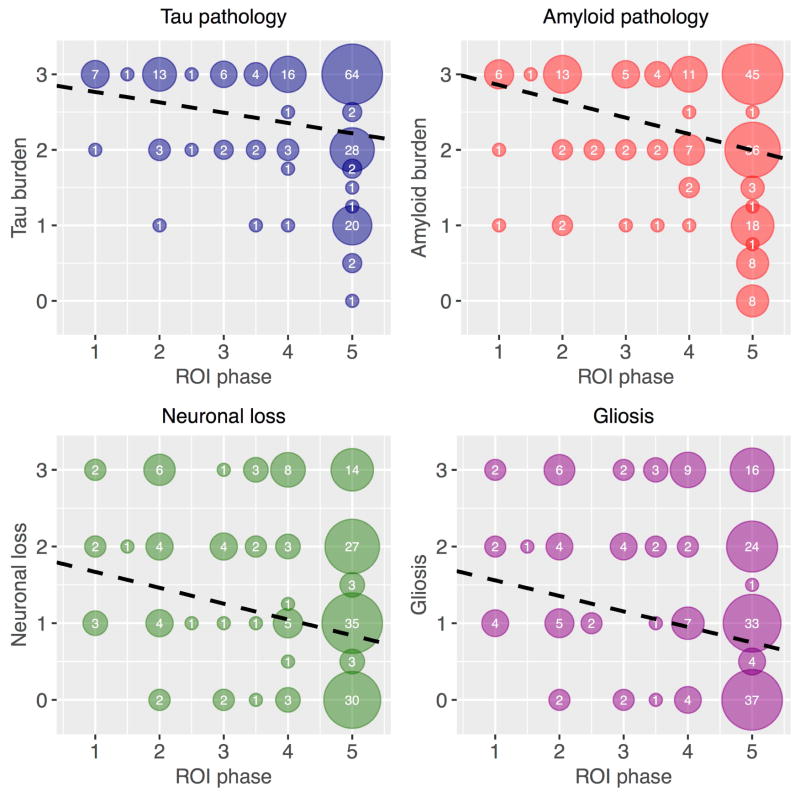
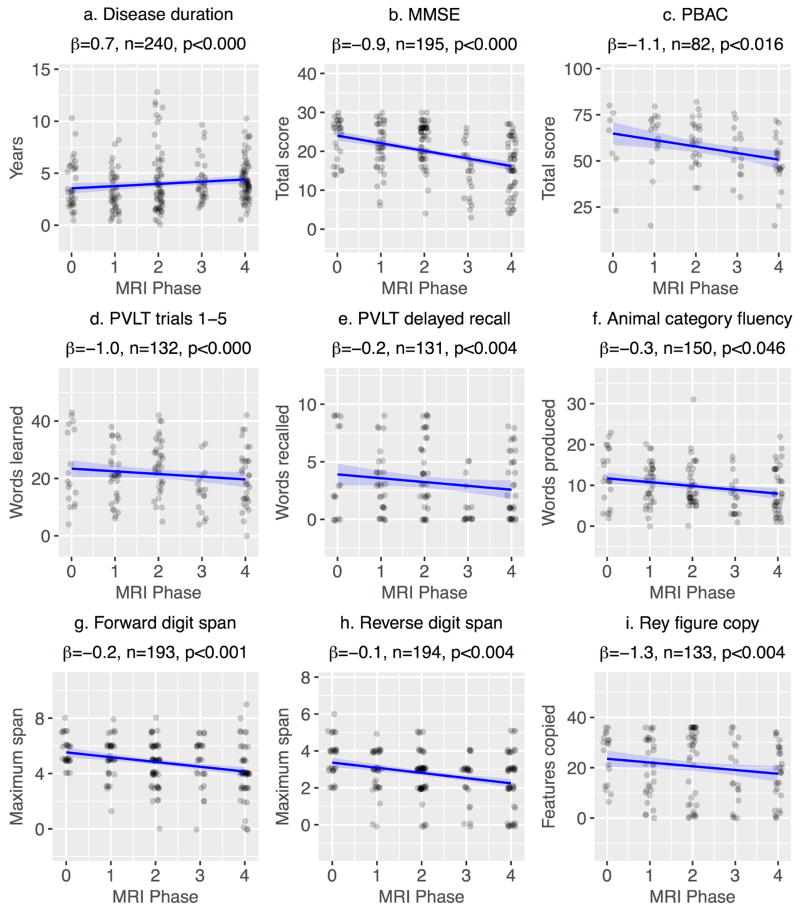
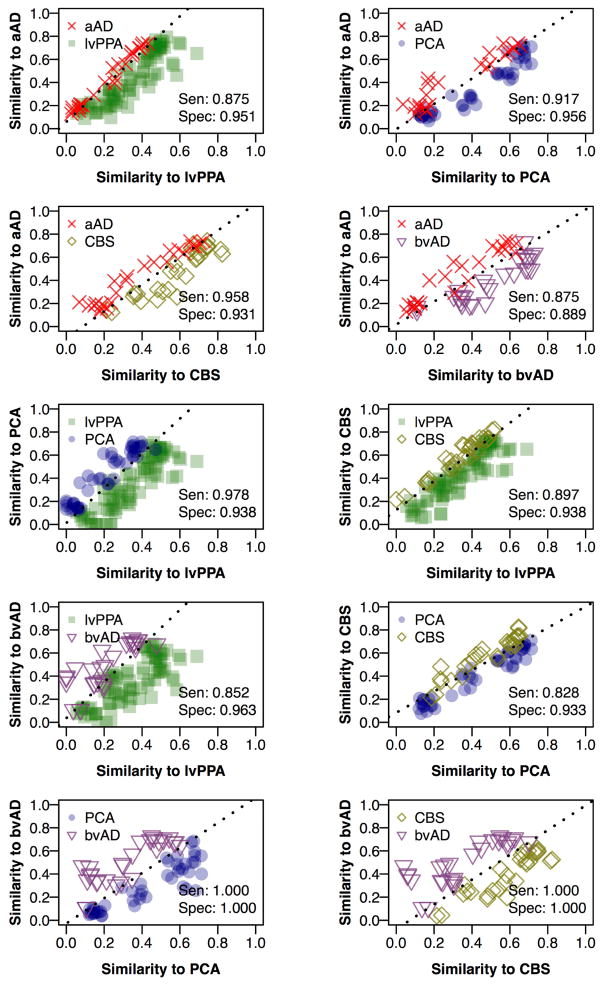
Amnestic Alzheimer's disease (AD) is characterized by early atrophy of the hippocampus and medial temporal lobes before spreading to the neocortex. In contrast, nonamnestic Alzheimer's patients have relative sparing of the hippocampus, but the pattern in which the disease spreads is unclear. We examined spreading disease in nonamnestic AD using a novel magnetic resonance imaging-based analysis adapted from pathologic staging studies, applied here to cross-sectional imaging data. We selected 240 T1-weighted scans from 129 patients with pathology confirmed by autopsy or cerebrospinal fluid, and atrophy maps were computed relative to 238 scans from 115 elderly controls. For each phenotype, the frequency of atrophy in 116 brain regions was used to infer the anatomical origin of disease and its progression across 4 phases of atrophy. Results from the amnestic cohort were used to determine appropriate parameter settings for the phase assignment algorithm, based on correspondence to Braak pathology staging. Phase 1 regions, which represent the origin of disease, included the hippocampus for the amnestic group (comprising 33 scans); left lateral temporal lobe for logopenic-variant primary progressive aphasia (88 scans); occipitoparietal cortex for posterior cortical atrophy (51 scans); temporoparietal cortex for corticobasal syndrome (31 scans); and frontotemporal cortex for behavioral/dysexecutive variant AD (37 scans). In nonamnestic patients, atrophy spread to other neocortical areas in later phases, but the hippocampus exhibited only late-phase atrophy in posterior cortical atrophy and corticobasal syndrome. Region-specific phase values were also associated with regional measures of tau, beta amyloid, neuronal loss, and gliosis for the subset of patients (n = 17) with neuropathology findings; this comparison represented a first validation of the phase assignment algorithm. We subsequently assigned a phase to each patient scan based on the similarity of regional atrophy patterns with atrophy predicted for the corresponding phenotype at each phase. Scan-specific phases were correlated with disease duration as well as global and domain-specific cognition, supporting these phase values as global estimates of patients' disease progression. Logistic regression models based on spatial overlap with model-predicted atrophy patterns reliably discriminated nonamnestic phenotypes from each other and from amnestic AD. The frequency-based phase assignment algorithm used in the present study thus represents a promising approach for studying the neocortical origin and spread of disease in nonamnestic AD.
Keywords: Alzheimer's disease; Atrophy; Braak staging; Corticobasal syndrome; Disease progression; Frontalvariant Alzheimer's disease; Hippocampus; Logopenic-variant primary progressive aphasia; Magnetic resonance imaging; Non-amnestic Alzheimer's disease; Posterior cortical atrophy; tau.
Copyright © 2017 Elsevier Inc. All rights reserved.
Conflict of interest statement
Figures
References
-
- Alladi S, Xuereb J, Bak T, Nestor P, Knibb J, Patterson K, Hodges JR. Focal cortical presentations of Alzheimer’s disease. Brain. 2007;130(10):2636–2645. https://doi.org/10.1093/brain/awm213. - DOI - PubMed
-
- Andrade K, Kas A, Samri D, Sarazin M, Dubois B, Habert MO, Bartolomeo P. Visuospatial deficits and hemispheric perfusion asymmetries in posterior cortical atrophy. Cortex. 2013;49(4):940–947. https://doi.org/10.1016/j.cortex.2012.03.010. - DOI - PubMed
-
- Avants BB, Libon DJ, Rascovsky K, Boller A, McMillan CT, Massimo L, … Grossman M. Sparse canonical correlation analysis relates network-level atrophy to multivariate cognitive measures in a neurodegenerative population. NeuroImage. 2014a;84:698–711. https://doi.org/10.1016/j.neuroimage.2013.09.048. - DOI - PMC - PubMed
-
- Avants BB, Tustison NJ, Song G, Cook PA, Klein A, Gee JC. A reproducible evaluation of ANTs similarity metric performance in brain image registration. NeuroImage. 2011;54(3):2033–2044. http://doi.org/10.1016/j.neuroimage.2010.09.025. - DOI - PMC - PubMed
-
- Avants BB, Tustison NJ, Stauffer M, Song G, Wu B, Gee JC. The Insight ToolKit image registration framework. Frontiers in Neuroinformatics. 2014b:8. https://doi.org/10.3389/fninf.2014.00044. - DOI - PMC - PubMed
Publication types
MeSH terms
Grants and funding
LinkOut - more resources
Full Text Sources
Other Literature Sources
Medical
