

An automated method to detect and quantify fungiform papillae in the human tongue: Validation and relationship to phenotypical differences in taste perception
- PMID: 29223711
- PMCID: PMC5766753
- DOI: 10.1016/j.physbeh.2017.12.003
An automated method to detect and quantify fungiform papillae in the human tongue: Validation and relationship to phenotypical differences in taste perception
Abstract
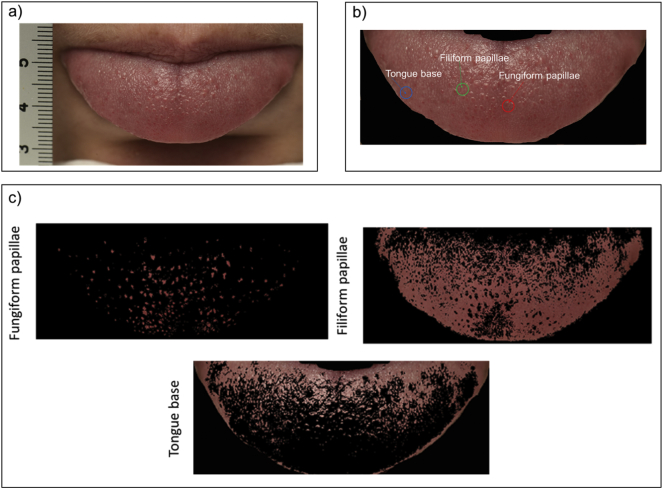
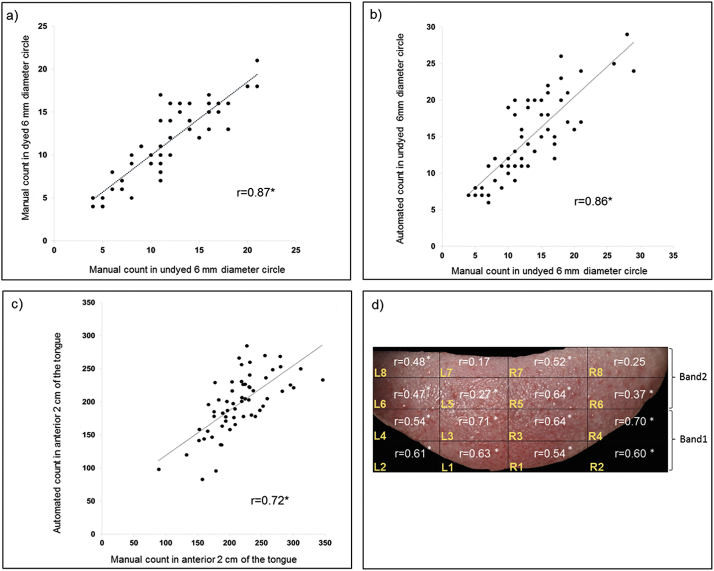
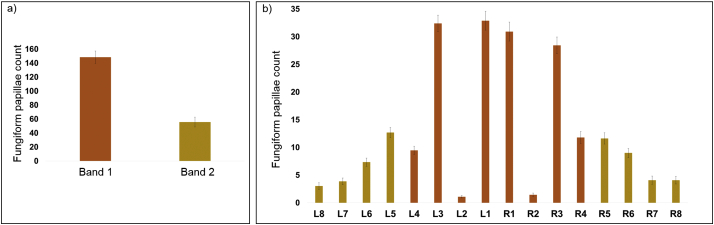
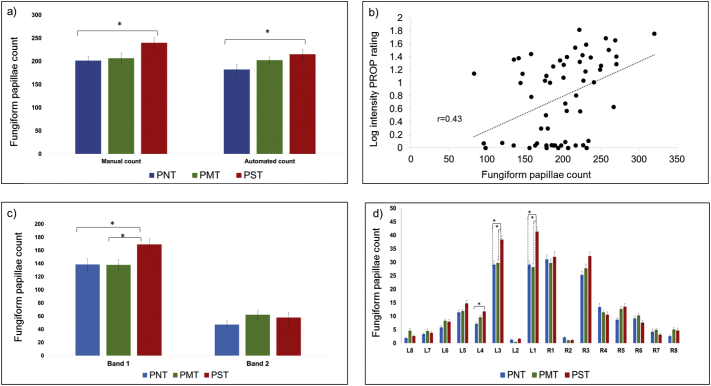
Determination of the number of fungiform papillae (FP) on the human tongue is an important measure that has frequently been associated with individual differences in oral perception, including taste sensitivity. At present, there is no standardised method consistently used to identify the number of FP, and primarily scientists manually count papillae over a small region(s) of the anterior tip of a stained tongue. In this study, a rapid automated method was developed to quantify the number of FP across the anterior 2cm of an unstained tongue from high resolution digital images. In 60 participants, the automated method was validated against traditional manual counting, and then used to assess the relationship between the number of FP and taste phenotype (both 6-n-propylthiouracil (PROP) and Thermal Taster Status). FP count on the anterior 2cm of the tongue was found to correlate significantly with PROP taster status. PROP supertasters (PSTs) had a significantly higher FP count compared with PROP non-tasters (PNTs). Conversely, the common approach used to determine the number of FP in a small 6mm diameter circle on the anterior tongue tip, did not show a significant correlation irrespective of whether it was determined via automated or manual counting. The regional distribution of FP was assessed across PROP taster status groups. PSTs had a significantly higher FP count within the first centimetre of the anterior tongue compared with the PNT and PROP medium-tasters (PMT), with no significant difference in the second centimetre. No significant relationship was found with Thermal Taster Status and FP count, or interaction with PROP taster status groups, supporting previous evidence suggesting these phenomena are independent. The automated method is a valuable tool, enabling reliable quantification of FP over the anterior 2cm surface of the tongue, and overcomes subjective discrepancies in manual counting.
Keywords: Automated counting; Colour segmentation; Fungiform papillae; PROP; Thermal taster status; Tongue images.
Copyright © 2017 The Authors. Published by Elsevier Inc. All rights reserved.
Figures
Similar articles
-
Comparison of manual and machine learning image processing approaches to determine fungiform papillae on the tongue.Sci Rep. 2020 Oct 29;10(1):18694. doi: 10.1038/s41598-020-75678-2. Sci Rep. 2020. PMID: 33122666 Free PMC article.
-
Thermal taste, PROP responsiveness, and perception of oral sensations.Physiol Behav. 2008 Nov 28;95(4):581-90. doi: 10.1016/j.physbeh.2008.08.009. Epub 2008 Aug 22. Physiol Behav. 2008. PMID: 18773913 Clinical Trial.
-
Relation between PROP (6-n-propylthiouracil) taster status, taste anatomy and dietary intake measures for young men and women.Appetite. 2002 Jun;38(3):201-9. doi: 10.1006/appe.2001.0481. Appetite. 2002. PMID: 12071686
-
PTC/PROP tasting: anatomy, psychophysics, and sex effects.Physiol Behav. 1994 Dec;56(6):1165-71. doi: 10.1016/0031-9384(94)90361-1. Physiol Behav. 1994. PMID: 7878086 Review.
-
Associations between human fungiform papillae and responsiveness to oral stimuli: effects of individual variability, population characteristics, and methods for papillae quantification.Chem Senses. 2018 May 23;43(5):313-327. doi: 10.1093/chemse/bjy015. Chem Senses. 2018. PMID: 29490007 Review.
Cited by
-
Impact of Fungiform Papillae Count on Taste Perception and Different Methods of Taste Assessment and their Clinical Applications: A comprehensive review.Sultan Qaboos Univ Med J. 2019 Aug;19(3):e184-e191. doi: 10.18295/squmj.2019.19.03.003. Epub 2019 Nov 5. Sultan Qaboos Univ Med J. 2019. PMID: 31728215 Free PMC article. Review.
-
Comparison of manual and machine learning image processing approaches to determine fungiform papillae on the tongue.Sci Rep. 2020 Oct 29;10(1):18694. doi: 10.1038/s41598-020-75678-2. Sci Rep. 2020. PMID: 33122666 Free PMC article.
-
Development of a Regional Taste Test that uses Edible Circles for Stimulus Delivery.Chemosens Percept. 2019 Oct;12:115-124. doi: 10.1007/s12078-019-09265-9. Epub 2019 Apr 12. Chemosens Percept. 2019. PMID: 31827664 Free PMC article.
-
Histopathology of the Tongue in a Hamster Model of COVID-19.Res Sq [Preprint]. 2024 Jul 4:rs.3.rs-4590482. doi: 10.21203/rs.3.rs-4590482/v1. Res Sq. 2024. Update in: BMC Oral Health. 2025 Jan 23;25(1):121. doi: 10.1186/s12903-025-05420-9. PMID: 39011098 Free PMC article. Updated. Preprint.
-
Histopathology of the tongue in a hamster model of COVID-19.BMC Oral Health. 2025 Jan 23;25(1):121. doi: 10.1186/s12903-025-05420-9. BMC Oral Health. 2025. PMID: 39849469 Free PMC article.
References
-
- Bajec M.R., Pickering G.J. Thermal taste, PROP responsiveness, and perception of oral sensations. Physiol. Behav. 2008;95(4):581–590. - PubMed
-
- Bartoshuk L., Duffy V., Miller I. PTC/PROP tasting: anatomy, psychophysics, and sex effects. Physiol. Behav. 1994;56:1165–1171. - PubMed
-
- Bartoshuk L.M., Duffy V.B., Fast K., Green B.G., Prutkin J., Snyder D.J. Labeled scales (e.g., category, Likert, VAS) and invalid across-group comparisons: what we have learned from genetic variation in taste. Food Qual. Prefer. 2002;14:125–138.
-
- Chang W., Chung J., Kim Y., Chung S., Kho H. The relationship between phenylthiocarbamide (PTC) and 6-n-propylthiouracil (PROP) taster status and taste thresholds for sucrose and quinine. Arch. Oral Biol. 2006;51:427–432. - PubMed
-
- Cheng L.H.H., Robinson P.P. The distribution of fungiform papillae and taste buds on the human tongue. Arch. Oral Biol. 1991;36(8):583–589. - PubMed
Publication types
MeSH terms
LinkOut - more resources
Full Text Sources
Other Literature Sources
Medical
