. 2018 Jan;30(1):e12563.
doi: 10.1111/jne.12563.

Circadian peak dopaminergic activity response at the biological clock pacemaker (suprachiasmatic nucleus) area mediates the metabolic responsiveness to a high-fat diet

Affiliations

Circadian peak dopaminergic activity response at the biological clock pacemaker (suprachiasmatic nucleus) area mediates the metabolic responsiveness to a high-fat diet

S Luo et al. J Neuroendocrinol. 2018 Jan.

Abstract

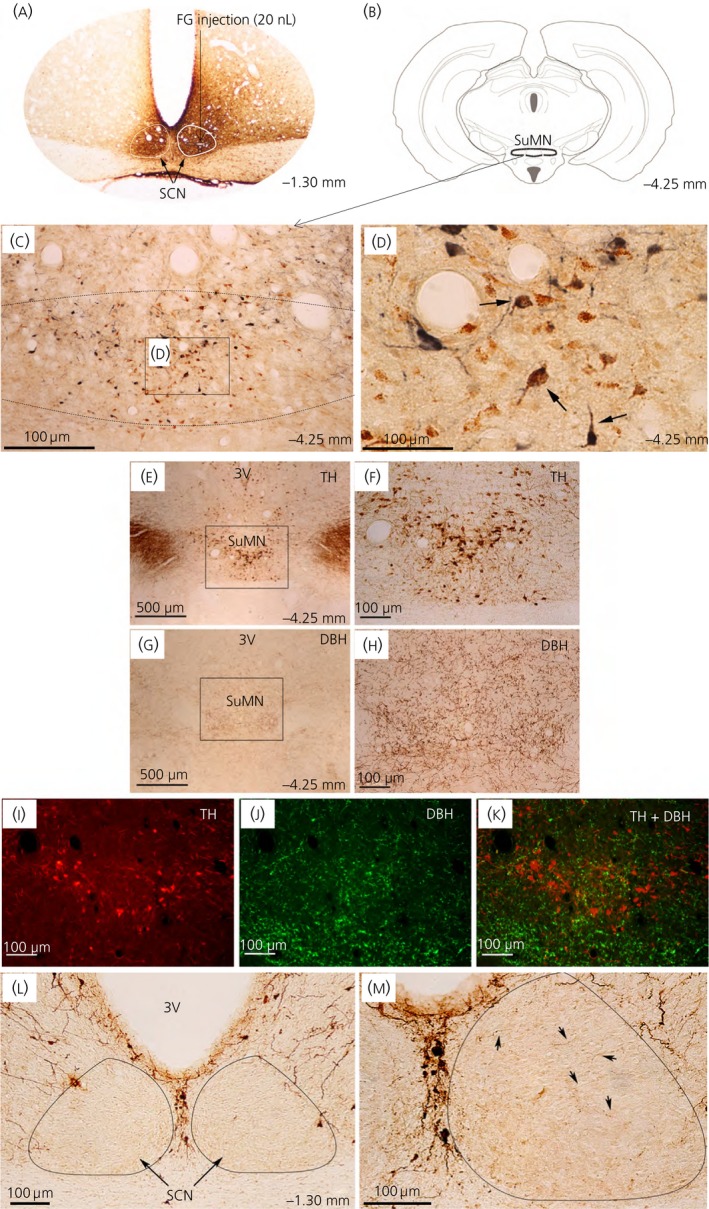
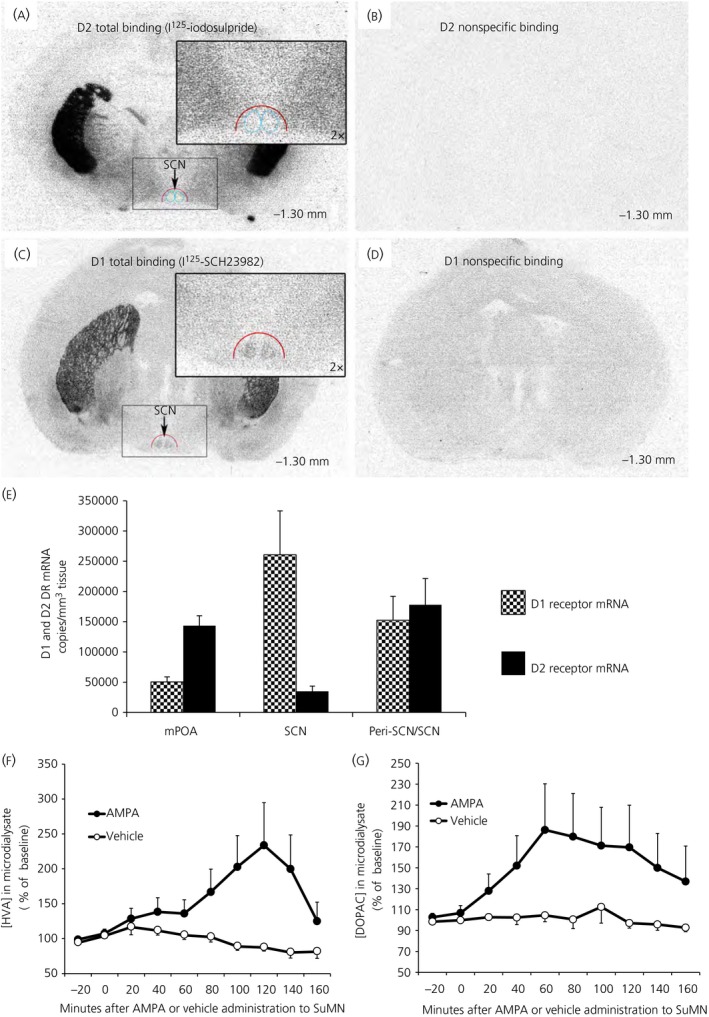
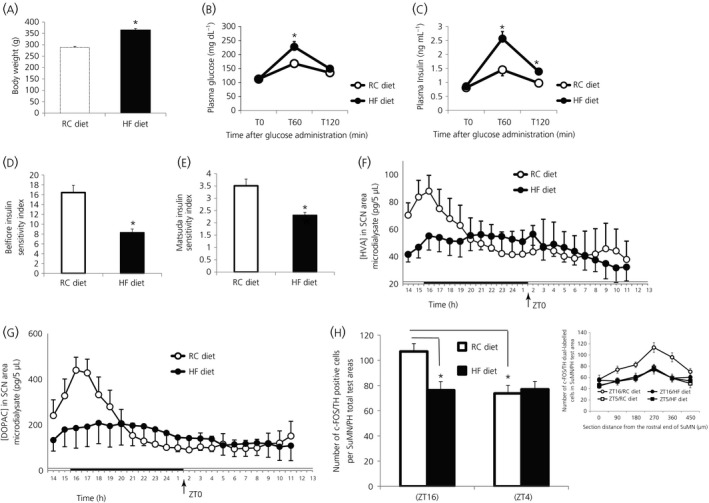
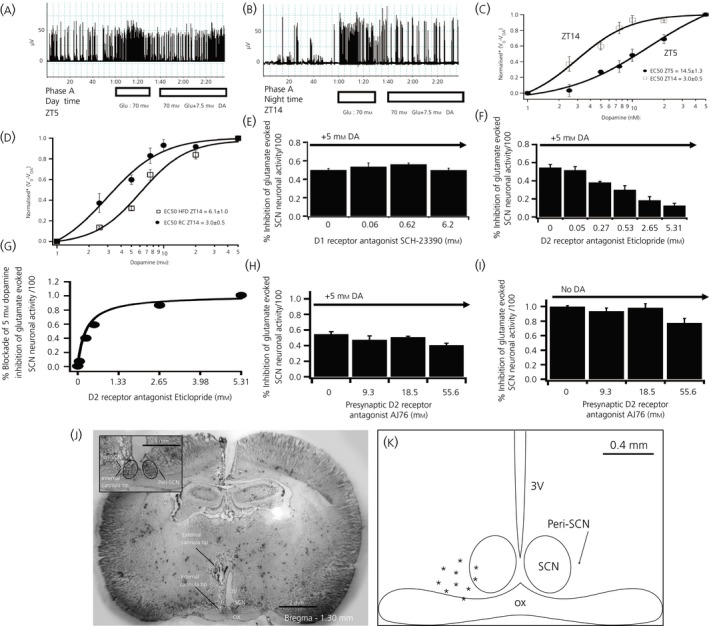
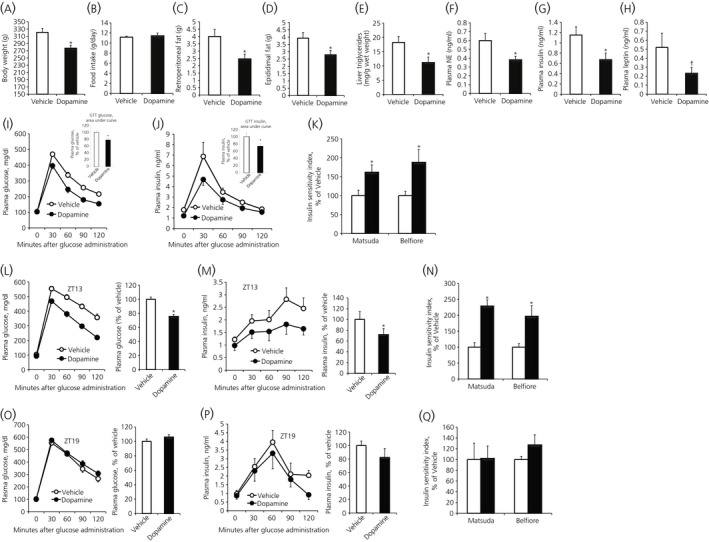
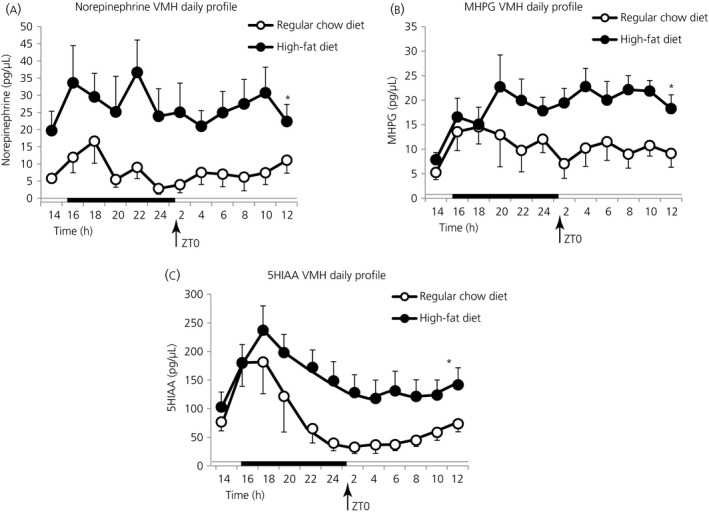
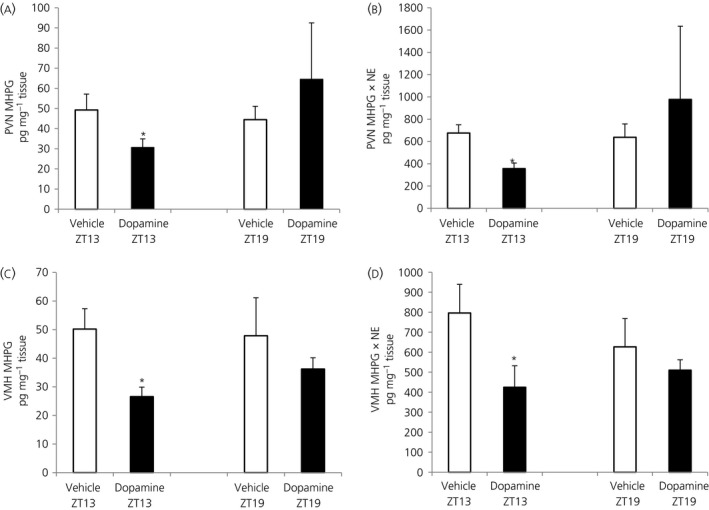
Among vertebrate species of the major vertebrate classes in the wild, a seasonal rhythm of whole body fuel metabolism, oscillating from a lean to obese condition, is a common biological phenomenon. This annual cycle is driven in part by annual changes in the circadian dopaminergic signalling at the suprachiasmatic nuclei (SCN), with diminution of circadian peak dopaminergic activity at the SCN facilitating development of the seasonal obese insulin-resistant condition. The present study investigated whether such an ancient circadian dopamine-SCN activity system for expression of the seasonal obese, insulin-resistant phenotype may be operative in animals made obese amd insulin resistant by high-fat feeding and, if so, whether reinstatement of the circadian dopaminergic peak at the SCN would be sufficient to reverse the adverse metabolic impact of the high-fat diet without any alteration of caloric intake. First, we identified the supramammillary nucleus as a novel site providing the majority of dopaminergic neuronal input to the SCN. We further identified dopamine D2 receptors within the peri-SCN region as being functional in mediating SCN responsiveness to local dopamine. In lean, insulin-sensitive rats, the peak in the circadian rhythm of dopamine release at the peri-SCN coincided with the daily peak in SCN electrophysiological responsiveness to local dopamine administration. However, in rats made obese and insulin resistant by high-fat diet (HFD) feeding, these coincident circadian peak activities were both markedly attenuated or abolished. Reinstatement of the circadian peak in dopamine level at the peri-SCN by its appropriate circadian-timed daily microinjection to this area (but not outside this circadian time-interval) abrogated the obese, insulin-resistant condition without altering the consumption of the HFD. These findings suggest that the circadian peak of dopaminergic activity at the peri-SCN/SCN is a key modulator of metabolism and the responsiveness to adverse metabolic consequences of HFD consumption.

Keywords: circadian; diabetes; dopamine; insulin sensitivity; suprachiasmatic nuclei.


Figures

Figure 1
Figure 1
Dopamine neurones at the supramammillary nucleus (SuMN) project to the peri‐suprachiasmatic nuclei (peri‐SCN)/SCN region. (A‐D) The primary neurones that project to the peri‐SCN/SCN region were retrogradely traced by microinjection of fluorogold (FG) (4%; 20 nL) at the peri‐SCN/SCN region followed by double‐immunohistochemistry using antibodies against FG and tyrosine hydroxylase (TH) (the rate‐limiting enzyme for catecholamine synthesis). A predominant cluster of FG/TH dual immunolabelled neurones were identified at the SuMN. (A) FG at the injection site revealed by brown 3,3′‐diaminobenzidine (DAB) was localised at the peri‐SCN/SCN (Bregma ‐1.30) with diffuse transport/migration (including contralateral SCN) at 10 days after its microinjection at the right SCN. (B) Schematic of the coronal section at the level of SuMN (Bregma ‐4.25 mm). (C) FG/TH dual‐labelled cells at the SuMN (low magnification). Dashed line indicates SuMN border. (D) High magnification of FG/TH‐dual labelled cells at the SuMN. FG‐immunoreactivity was labelled as brown punctuates in the cytoplasm and processes. TH‐immunopositivity was labelled as diffuse blue‐grey staining in the cytoplasm and processes. Arrows indicate FG/TH double‐immunopositive cells. (E‐K) The TH‐immunopositive neurones that project to the peri‐SCN/SCN region are dopamine neurones. The dopaminergic neurones at the SuMN were identified as TH‐immunopostive and dopamine β‐hydroxylase (DBH)‐immunonegative neurones. TH‐immunopositive cell bodies and processes revealed by brown DAB staining using antibody against TH were found in the SuMN at low magnification (E) and at high magnification (F). DBH‐immunopositive terminals (but not cell bodies) revealed by brown DAB staining coupled with antibody against DBH were detected in the SuMN at low magnification (G) and at high magnification (H). Double‐immunofluorescence staining of TH (I) and DBH (J) on the same brain section showed no co‐localisation of TH‐immunoreactivity (red) and DBH‐immunoreactivity (green) in cells detected in the SuMN (K). Brain section: bregma ‐4.25 mm. 3V, third ventricle. (L, M) Immunohistochemical staining of dopaminergic innervations revealed by brown DAB staining coupled with antibody against TH were found predominantly in the peri‐SCN region with sparse but detectable staining in the SCN. (L) Dense TH‐immunopositive processes at peri‐SCN. (M) Sparse TH‐immunopositive processes within SCN (high magnification). Arrows point to the TH‐immunoreactivity inside SCN. Brain section: bregma ‐1.30 mm
Figure 2
Figure 2
(A‐E) Dopamine receptor binding and mRNA present in peri‐suprachiasmatic nuclei (SCN)/SCN area. (A) Autoradiography using radioligands selective for dopamine receptor D2 (I125‐iodosulpride) in brain sections at the level of the SCN (bregma ‐1.30 mm). [I125]‐iodosulpride revealed low density D2 dopamine receptor binding sites within SCN (blue cycle) and higher (moderate) density binding in peri‐SCN (red semicycle). Insert: higher magnification of peri‐SCN/SCN. (B) The binding specificity of [I125]‐iodosulpride (0.5 nm, K d = 1.6 nm) to D2 dopamine receptors was confirmed by the displacement of the [I125]‐iodosulpride binding sites with a saturation concentration of dopamine D2 receptor antagonist haloperidol (10 μm). (C) Autoradiograph ligand binding study with [I125]‐SCH23982 revealed a moderate density of dopamine D1 receptor binding sites within the SCN and low binding density in the peri‐SCN (red semicycle). Dopamine D1 receptors are defined by [I125]‐SCH23982 binding sites (0.1 nm, K d = 0.12 nm) in the presence of 5‐HT 2A/2C antagonists (ketanserin, 50 nm and mianserin, 100 nm). Insert: high magnification of peri‐SCN/SCN. (D) The binding specificity to dopamine D1 receptors was confirmed by the displacement of the [I125]‐SCH23982 binding sites with a saturation concentration of dopamine D1 receptor antagonist R‐(+)‐SCH23390 (10 μm). (E) Dopamine D1 and D2 receptor mRNA at the medial preoptic area (mPOA), periSCN/SCN and SCN regions of the hypothalamus quantified by a quantitative reverse transcriptase‐polymerase chain reaction (PCR). Dopamine D1 and D2 receptor mRNA actual transcript number per mm3 of tissue at the mPOA, peri‐SCN/SCN and SCN areas were each quantified by generation of standard curves with a Bio‐Rad PrimePCR template (assay ID qRnoCEP0027016 for dopamine D1 receptor and qRnoCIP0023714 for dopamine D2 receptor) as standard. Such transcripts for dopamine D2 receptor were much lower than that at the striatum (15 million copies per mm3 of tissue). Relative concentrations of Dopamine D2 and D1 receptor mRNA among these brain regions were not altered when normalised to GAPDH mRNA (GAPDH quantified with Bio‐Rad assay qRnoCIP0050838). Reduction of dopamine D1 receptor mRNA transcript density in peri‐SCN/SCN vs SCN area reflects dilution of SCN transcript with peri‐SCN tissue of much reduced D1 mRNA content. Results are the mean ± SEM of tissue samples from 5 animals. (F, G) Neurophysiological dopamine communication from the supramammillary nucleus (SuMN) to SCN. Acute intra‐SuMN AMPA administration increases the extracellular dopamine metabolites 3,4‐dihydroxyphenylacetic acid (DOPAC) and homovanillic acid (HVA) at the SCN. Extracellular profiles of HVA (F) and DOPAC (G) in microdialysate samples from the SCN of freely‐moving rats that received either acute intra‐SuMN AMPA (●) or vehicle (○). Data are expressed as percentage changes from the baseline (mean ± SEM, n = 6 per group). Two‐way anova with repeated measures on HVA (F) indicates a time effect (F 9,90 = 2.026, P < .05) and also a time and treatment interaction effect (F 9,90 = 3.368, P <0.005). SCN DOPAC (G) is increased in AMPA treated vs vehicle groups (F 1,10 = 5.387, P < .05). There is also a time effect (F 9,90 = 2.509, P < .05) and a time and treatment interaction effect (F 9,90 = 2.065, P < .05)
Figure 3
Figure 3
The high‐fat diet (HFD) feeding‐induced obese and insulin‐resistant condition is accompanied by a concurrent abolishment of the circadian peak in suprachiasmatic nuclei (SCN) dopaminergic activity and of the coincident daily peak in dopaminergic neurone activity in supramammillary nucleus (SuMN) neurones. Animals were fed HFD for 9 weeks and, after 32% of gain in body weight, analyses of SCN area dopamine release and SuMN dopamine activity at different circadian time points were performed. (A) Body weight of regular chow (RC, white bar) and HFD (black bar) fed rats (*P < .0001, HFD fed vs RC fed group) (Student's t test). Plasma glucose (B) and insulin (C) during a glucose tolerance test (*P < .05, difference between the two groups at same time) (anova with repeated measures followed by post‐hoc t test). The area under the glucose and insulin tolerance curve in the HFD fed group increased by 23% and 57% respectively, compared to the RC fed group (P < .05, Student's t test). HFD feeding induces insulin resistance (reduces Belfiore and Matsuda insulin sensitivity indices by 50% [D] or 34% [E], respectively, *P < .005 [Student's t test]). (F,G) Daily profiles of homovanillic acid (HVA) and 3,4‐dihydroxyphenylacetic acid (DOPAC), respectively in 5‐μL microdialysate samples from the SCN of freely‐moving rats fed either HFD (●) or RC (○) (n = 8 per group). The horizontal bar indicates light and dark phases of the daily photoperiod. Two‐way anova with repeated measures on HVA indicates a time of day effect (F 21,294 = 4.3, P < .0001). There is also a time and group interaction effect (F 21,294 = 3.2, P < .0001), which indicates a circadian difference of SCN dopamine activity between the HFD and RC fed groups. Two‐way anova with repeated measures on DOPAC (G) reveals a time of day effect (F 21,294 = 5.488, P < .0001) and a time and group interaction effect (F 21,294 = 2.578, P < .0002). All data are expressed as the mean ± SEM (n = 10 per group). (H) The daily peak dopamine neuronal activities at the SuMN and adjacent posterior hypothalamus (PH) were reduced by HFD feeding. The brains from HFD fed obese rats and RC fed lean rats on LD 14:10 h photoperiods were collected during the day (ZT4 [Zeitgeber time] hours after light on set) and night (ZT16), respectively. The activated dopamine neurones were identified as double immune‐positive neurones using antibodies against tyrosine hydroxylase (TH) (a rate‐limiting enzyme for dopamine synthesis) and c‐Fos (neuronal activation marker). The number of activated dopamine neurones at the SuMN/adjacent posterior hypothalamus (determined as number per total sampled areas) in the brains from RC lean rats was 46% higher at ZT16 than at ZT4 (two‐way anova analysis: *P < .05; n = 8 or 9) and this circadian peak was abolished in the brains from HFD‐fed obese rats (*P < .05). Insert: Number of double positive neurons at each sampled area within the SuMN/PH for animals within each group (mean ± SEM).
Figure 4
Figure 4
Daily peak of suprachiasmatic nuclei (SCN) neuronal electrophysiological response to dopamine coincides with the circadian peak of dopamine release at SCN in healthy insulin‐sensitive animals and is reduced in high‐fat diet (HFD) fed rats. (A, B) Electrophysiological recording example of dopamine (DA) (7.5 mM) inhibition of glutamate (70 mM) evoked SCN neuronal activity at Zeitgeber time (ZT)5 (day time) and at ZT14 (just at darkness onset and the onset of locomotor activity in these nocturnal rodents). (C) Daily variation of peri‐SCN/SCN electrophysiological sensitivity to peri‐SCN dopamine inhibition (1, 2.5, 5, 10, 25 and 50 mm) of glutamate stimulation of SCN neurones at ZT5 and ZT14. A two‐way anova with repeated measures indicates a significant difference between the SCN neuronal response to dopamine inhibition at ZT14 and at ZT5 (F 1,35 = 25.597, P < .001). The half maximal effective concentration of dopamine inhibition to the SCN neuronal response at ZT5 (EC 50 = 14.5 ± 1.3 mm) was 4.8 times greater than at ZT14 (EC 50 = 3.0 ± 0.5 mm, P < .05). (D) SCN neuronal sensitivity response to peri‐SCN dopamine inhibition of peri‐SCN glutamate stimulation of SCN neurones at ZT14 in HFD and rodent chow (RC) fed rats. A two‐way anova with repeated measures indicates a much reduced SCN dopamine responsiveness at ZT14 in rats made obese by HFD feeding (F 6,48 = 54.3, P < .0001). (E) SCN neuronal responsiveness to dopamine inhibition in the presence of D1 specific receptor antagonist (SCH‐23390) at ZT14. SCH‐23390 did not alter peri‐SCN glutamate evoked SCN neuronal activity responsiveness to peri‐SCN dopamine inhibition at the tested dosages. (F,G) Glutamate‐evoked SCN neuronal activity responsiveness to peri‐SCN dopamine inhibition in the presence of D2 specific receptor antagonist (Eticlopride) at ZT14. D2 antagonist dose‐dependently blocked glutamate‐evoked SCN response to peri‐SCN dopamine (P < .05, One way anova). D2 antagonist eticlopride EC 50 = 265 μm. (H,I) Glutamate‐evoked SCN neuronal responsiveness in the presence of presynaptic antagonist (AJ76) at ZT14 with (H) or without (I) peri‐SCN dopamine applied. All values are the mean ± SEM (n = 5 per group). Higher dose AJ76 resulted in the slight inhibition of glutamate stimulation as may be expected from its potential consequent increase of endogenous synaptic dopamine level (subsequent to presynaptic dopamine D2 receptor blockade). (J) Histology of peri‐SCN injection cannula placement. The external cannula tip location was at the stereotaxic coordinates of anteroposterior −1.3, mediolateral 0.4 mm and dorsoventral −7.3 mm from dura. The injection cannula protruded 2 mm from the guide external cannula. The internal cannula tip shows the injection site. OX, optic chiasm; 3V, third ventricle. Enlarged peri‐SCN injection site is shown in the insert. The cannula placement was the same as the microdialysis probe location. (K) Diagrammatic representation of the peri‐SCN injection target site locations for animal brains confirmed histologically. The injection sites are between −0.1 mm and 0.4 mm lateral to the SCN. Only data from properly targeted cannula and probes were used for analyses. *Normalised V 0/VDA represents the fractional inhibition of glutamate evoked SCN neuronal activity relative to pre‐glutamate administration baseline activity level
Figure 5
Figure 5
Restoring the circadian dopamine peak (Zeitgeber time [ZT]13) at the peri‐suprachiasmatic nuclei (SCN) of high‐fat diet (HFD) fed, obese insulin‐resistant spontaneously hypertensive rats (SHR) rats improves dysmetabolism without affecting food consumption, whereas the same treatment outside this circadian peak window (ZT19) has no effect on insulin resistance of SHR rats. After 6 weeks on HFD, obese animals were treated daily with either vehicle (cerebrospinal fluid) or dopamine (2 nmol) infused at the peri‐SCN for 1 min unilaterally at 13 h after light onset (ZT13) for 2 weeks when maintained on the HFD. The following metabolic parameters were assessed after 2 weeks of treatment: (A) body weight at the end of treatment; (B) daily food consumption during the treatment (no difference); (C) retroperitoneal fat pad weight; (D) epididimal fat pad weight; (E) liver triglyceride level; (F) plasma norepinephrine; (G) plasma insulin; and (H) plasma leptin ( P < .05, 1‐tailed t test. (I) Glucose tolerance test (GTT) plasma glucose curves (line graph) and the area under the glucose GTT curve (bar graph). (J) GTT plasma insulin curves (line graph) and the area under the insulin GTT curve (bar graph) and (K) Matsuda and Belfiore insulin sensitivity indices of SHR rats on HFD treated with either vehicle or dopamine at ZT13. Data are expressed as the mean ± SEM (n = 9 per group) (*P < .05 compared to vehicle treatment, unpaired Student's t test). (L‐Q) Comparison of metabolic response to peri‐SCN dopamine administration at ZT13 vs ZT19. GTT from rats fed HFD for 6 weeks and then receiving dopamine (2 nmol) or vehicle at the onset of locomotor activity (ZT13) or at ZT19 for 2 additional weeks when held on HFD feeding. (L) GTT plasma glucose curves (line graph) and the area under the glucose GTT curve (bar graph), (M) GTT plasma insulin curves (line graph) and the area under the insulin GTT curve (bar graph) and (N) Matsuda and Belfiore insulin sensitivity indices of vehicle (white bar) or dopamine (black bar) peri‐SCN treated animals at ZT13. (O) GTT plasma glucose curves (line graph) and the area under the glucose GTT curve (bar graph), (P) GTT plasma insulin curves (line graph) and the area under the insulin GTT curve (bar graph) and (Q) Matsuda and Belfiore insulin sensitivity indices of SHR rats on HFD treated with either vehicle (white bar) or dopamine (black bar) at ZT19. Data are expressed as the mean ± SEM (n = 6 per group) (*P < .05, unpaired Student's t test)
Figure 6
Figure 6
High‐fat diet (HFD) feeding induces elevations in ventromedial hypothalamus (VMH) norepinephrine and serotonin activity. Female Sprague‐Dawley (SD) rats (4 week old, n = 7‐9 per group) were fed either a HFD or rodent chow (RC) diet for 6 weeks and then 24‐h in vivo VMH extracellular profiles of monoamine metabolites were investigated by 24‐h microdialysis sampling in each group. Daily profiles of (A) NE, (B) MHPG and (C) 5‐HIAA in microdialysate samples from VMH of freely‐moving rats fed either HFD (●) or RC (○) (n = 7 or 8 per group). The horizontal bar indicates light and dark phases. HFD fed rats exhibited elevated levels of VMH 3‐methoxy‐4‐hydroxyphenylglycol (MHPG), norepinephrine (NE) and 5‐HIAA compared to RC diet rats (by 38%, 63% and 48%, respectively). Repeated measures anova on NE indicated a group effect (F 1,13 = 14.01, P < .005), as did repeated measures anova on MHPG (F 1,13 = 5.334, P < .05). Repeated measures anova on 5‐HIAA also revealed a group effect (F 1,13 = 7.630, P < .05)
Figure 7
Figure 7
Dopamine administration at the peri‐suprachiasmatic nuclei (peri‐SCN) at Zeitgeber time (ZT)13 in high‐fat diet (HFD) fed rats to restore the normal circadian peak of dopamine at this site but not when administered outside this circadian peak window (at ZT19) reduced noradrenergic turnover/activity (3‐methoxy‐4‐hydroxyphenylglycol [MHPG] and MHPG × norepinephrine [NE] product) in both the ventromedial hypothalamus (VMH) and paraventricular nuclei (PVN). (A) PVN MHPG, (B) PVN MHPG × NE, (C) VMH MHPG and (D) VMH MHPG × NE content (pg mg‐1 tissue) in rats receiving dopamine (2 nmol) or vehicle infusion into the peri‐SCN area at the onset of locomotor activity (ZT13, n = 9 per group) and in rats receiving the same dose of vehicle or dopamine infusion at ZT19 (n = 7 or 5, respectively). Data are expressed as the mean ± SEM. (*P < .05 compared to vehicle treatment, unpaired Student's t test)

Similar articles

Cited by

References

    1. Meier AH, Cincotta AH. Circadian rhythms regulate the expression of the thrifty phenotype/phenotype. Diabetes Rev. 1996;4:464‐487. Full text is available at www.veroscience.com/pubs.html
    1. Cincotta AH. Hypothalamic role in the insulin resistance syndrome In: Hansen B, Shaffrir E, eds. Insulin Resistance and Insulin Resistance Syndrome. London: Taylor and Francis; 2002:271‐312.
    1. de Souza CJ, Meier AH. Circadian and seasonal variations of plasma insulin and cortisol concentrations in the Syrian hamster, Mesocricetus auratus . Chronobiol Int. 1987;4:141‐151. - PubMed
    1. Cincotta AH, Schiller BC, Meier AH. Bromocriptine inhibits the seasonally occurring obesity, hyperinsulinemia, insulin resistance, and impaired glucose tolerance in the Syrian hamster, Mesocricetus auratus . Metabolism. 1991;40:639‐644. - PubMed
    1. Luo S, Luo J, Cincotta AH. Suprachiasmatic nuclei monoamine metabolism of glucose tolerant versus intolerant hamsters. NeuroReport. 1999;10:2073‐2077. - PubMed

LinkOut - more resources