. 2017 Dec 14;171(7):1573-1588.e28.
doi: 10.1016/j.cell.2017.11.008. Epub 2017 Dec 7.

YY1 Is a Structural Regulator of Enhancer-Promoter Loops

Affiliations

YY1 Is a Structural Regulator of Enhancer-Promoter Loops

Abraham S Weintraub et al. Cell. .

Abstract

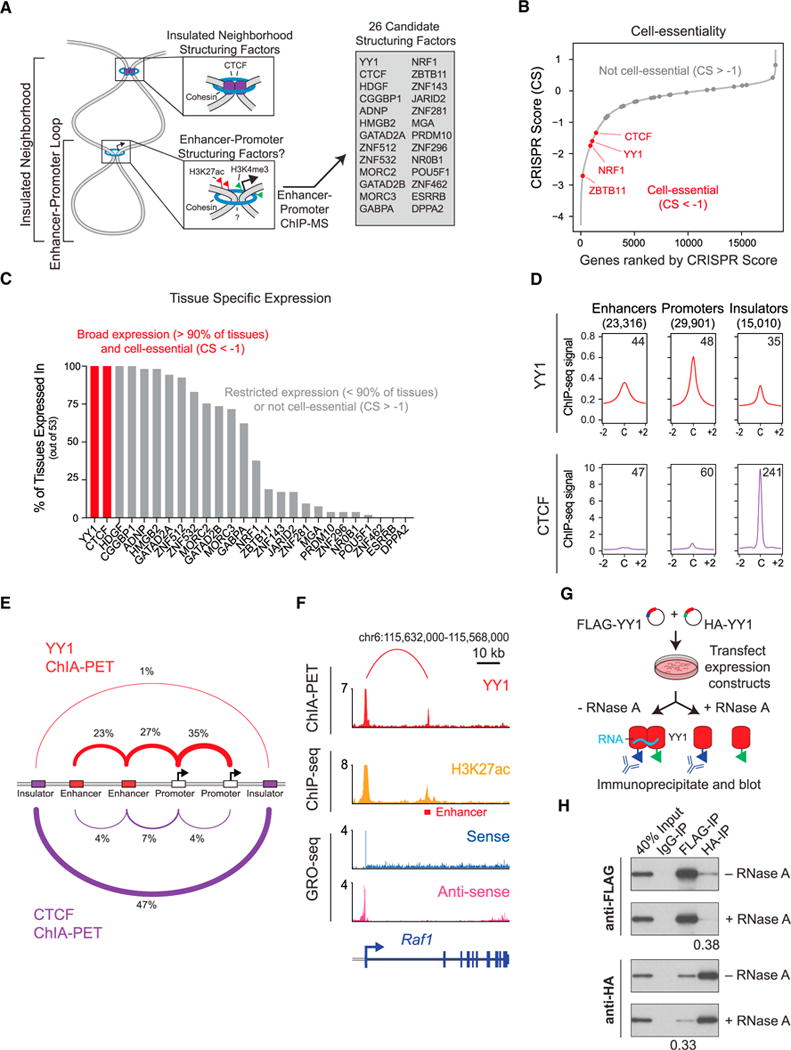
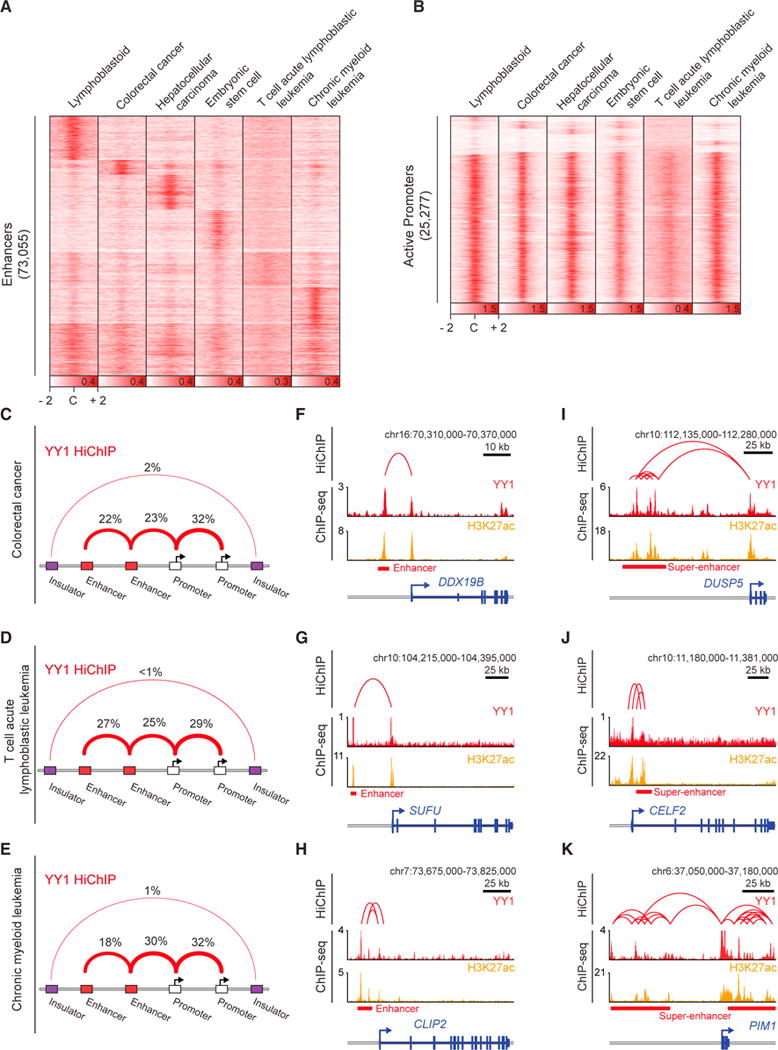
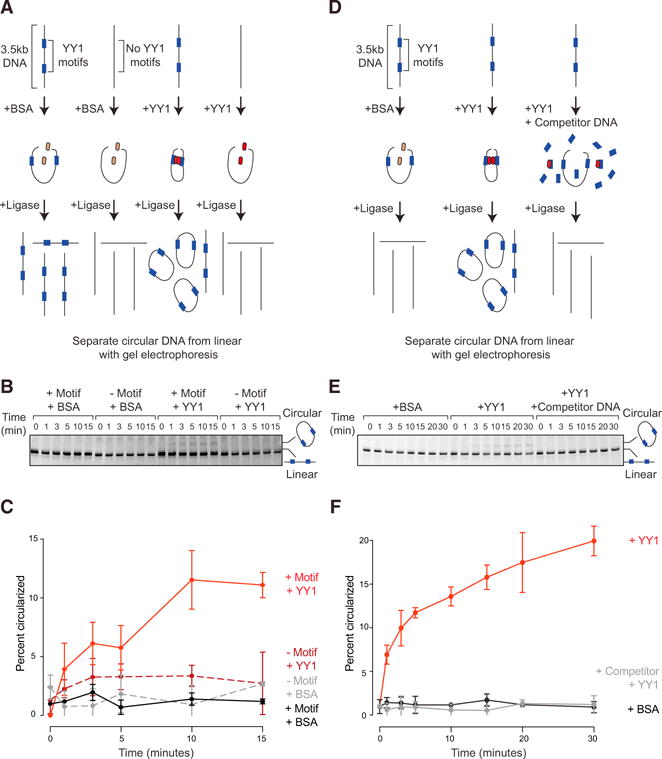
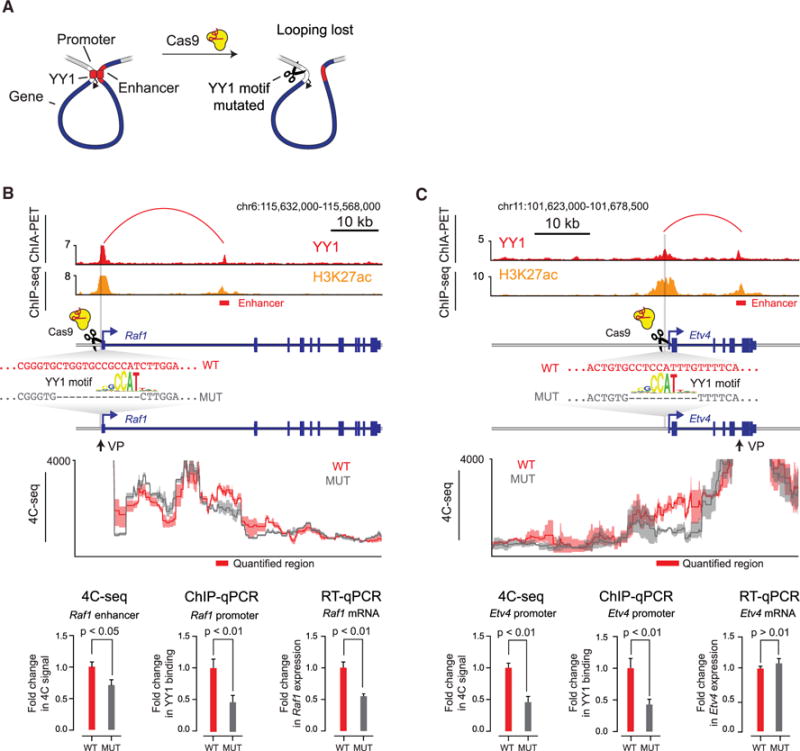
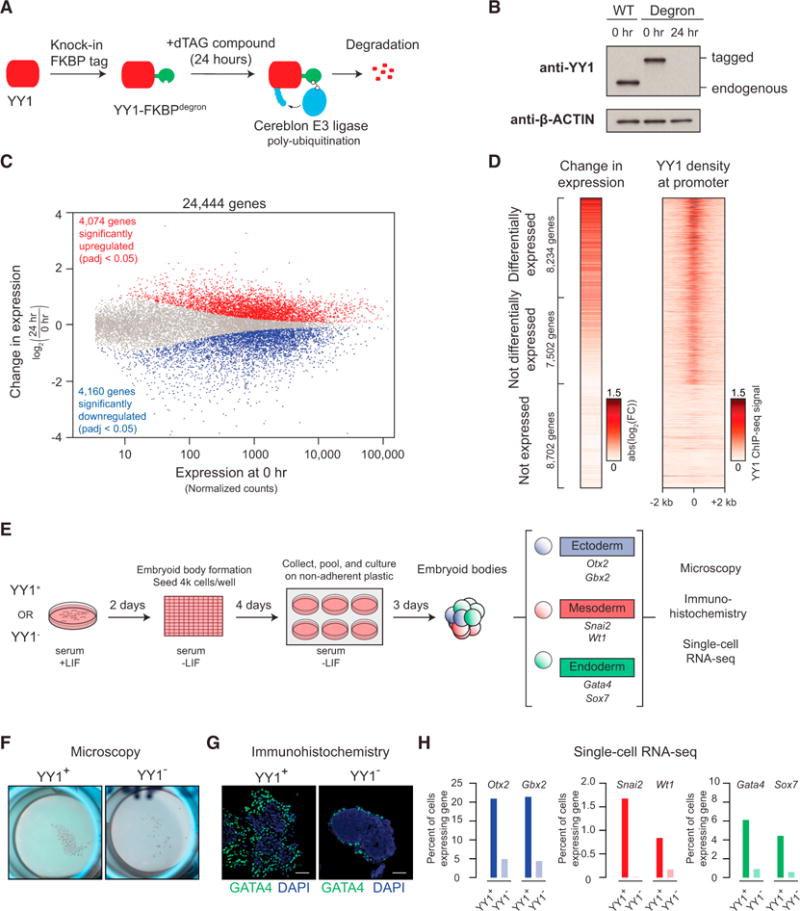
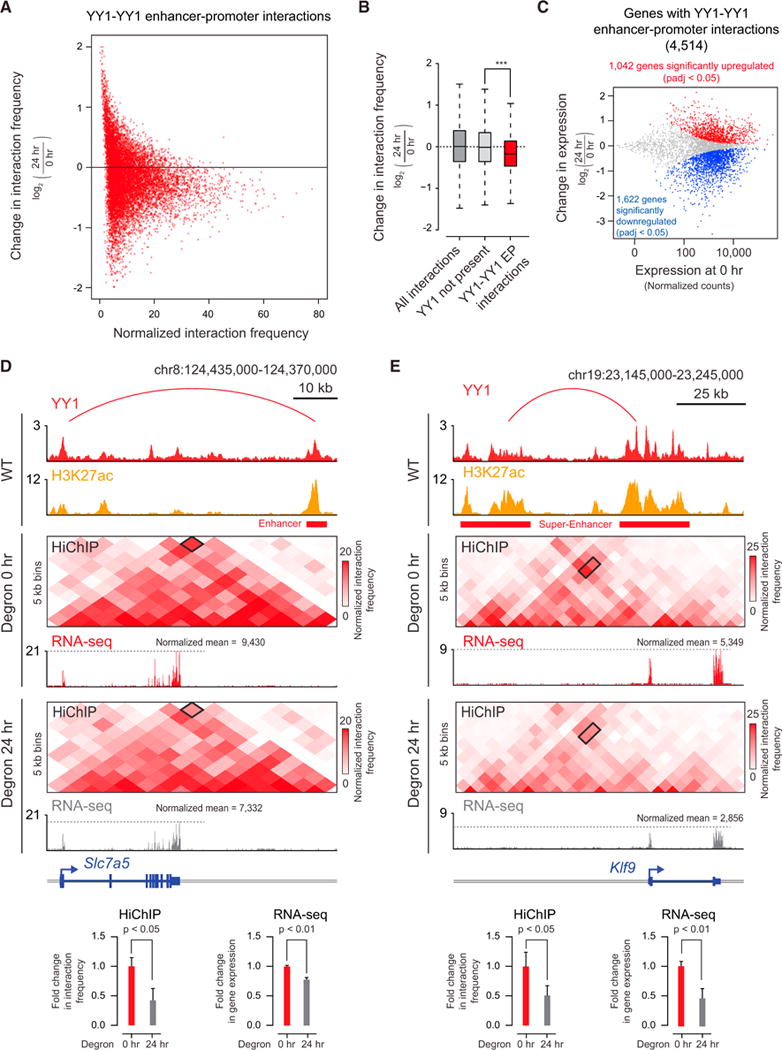
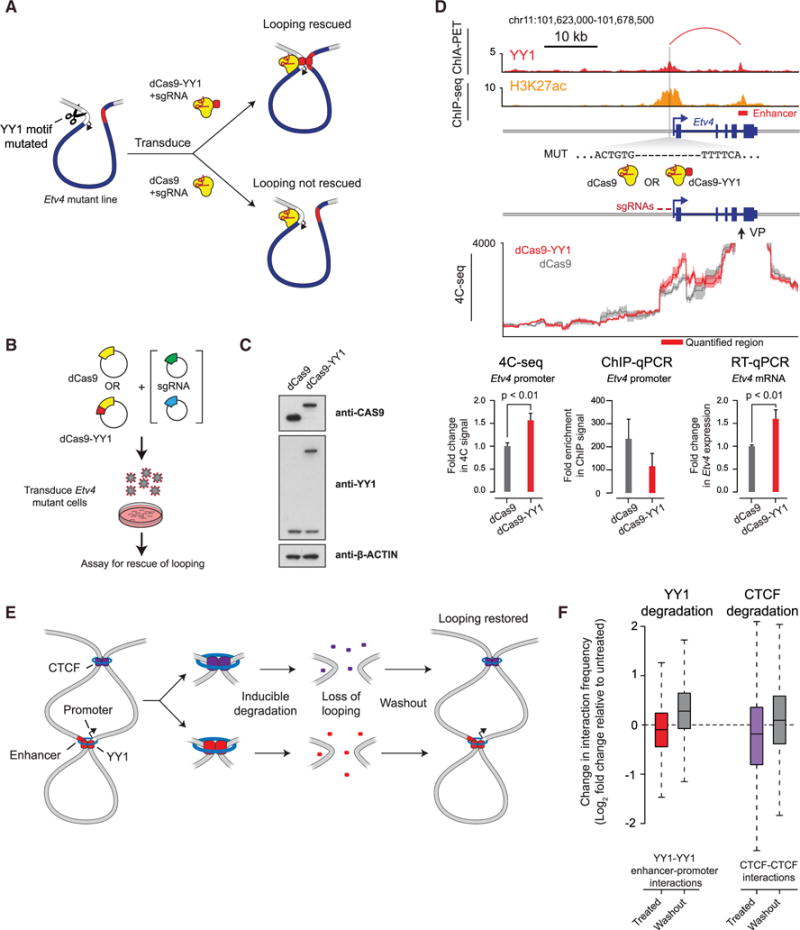
There is considerable evidence that chromosome structure plays important roles in gene control, but we have limited understanding of the proteins that contribute to structural interactions between gene promoters and their enhancer elements. Large DNA loops that encompass genes and their regulatory elements depend on CTCF-CTCF interactions, but most enhancer-promoter interactions do not employ this structural protein. Here, we show that the ubiquitously expressed transcription factor Yin Yang 1 (YY1) contributes to enhancer-promoter structural interactions in a manner analogous to DNA interactions mediated by CTCF. YY1 binds to active enhancers and promoter-proximal elements and forms dimers that facilitate the interaction of these DNA elements. Deletion of YY1 binding sites or depletion of YY1 protein disrupts enhancer-promoter looping and gene expression. We propose that YY1-mediated enhancer-promoter interactions are a general feature of mammalian gene control.

Keywords: chromosome structure; enhancers; gene regulation; promoters.


Figures

Figure 1
Figure 1. YY1 Is a Candidate Enhancer-Promoter Structuring Factor
(A) Model depicting an enhancer-promoter loop contained within a larger insulated neighborhood loop. Candidate enhancer-promoter structuring transcription factors were identified by ChIP-MS of histones with modifications characteristic of enhancer and promoter chromatin. (B) CRISPR scores (CS) of all genes in KBM7 cells from Wang et al. (2015). Candidate enhancer-promoter structuring factors identified by ChIP-MS are indicated as dots, and those identified as cell essential (CS < −1) are shown in red. (C) Histogram showing the number of tissues in which each candidate enhancer-promoter structuring factor is expressed across 53 tissues surveyed by GTEx. Candidates that are both broadly expressed (expressed in greater than 90% of tissues surveyed) and cell essential are shown in red. (D) Metagene analysis showing the occupancy of YY1 and CTCF at enhancers, promoters, and insulator elements in mouse embryonic stem cells. (E) Summary of the classes of high-confidence interactions identified by YY1 and CTCF ChIA-PET in mESCs. (F) Example of a YY1-YY1 enhancer-promoter interaction at the Raf1 locus in mESCs. (G) Model depicting co-immunoprecipitation assay to detect YY1 dimerization and evaluate dependence on RNA for YY1 dimerization. (H) Western blot results showing co-immunoprecipitation of FLAG-tagged YY1 and HA-tagged YY1 protein from nuclear lysates prepared from transfected cells. Quantification of the remaining signal normalized to input after RNase A treatment for the co-immunoprecipitated tagged YY1 is displayed under the relevant bands. See also Table S1 and Figure S1. See STAR Methods for detailed description of genomics analyses. Datasets used in this figure are listed in Table S4.
Figure 2
Figure 2. YY1 Generally Occupies Enhancers and Promoters in Mammalian Cells
(A and B) Heatmaps displaying the YY1 occupancy at enhancers (A) and active promoters (B) in six human cell types. (C–E) Summaries of the major classes of high-confidence interactions identified with YY1 HiChIP in colorectal cancer cells (C), T cell acute lymphoblastic leukemia cells (D), and chronic myeloid leukemia cells (E). (F–K) Examples of YY1-YY1 enhancer-promoter interactions in three human cell types: colorectal cancer (F and I), T cell acute lymphoblastic leukemia (G and J), and chronic myeloid leukemia (H and K). Displayed examples show YY1-YY1 enhancer-promoter interactions involving typical enhancers (F–H) and involving super-enhancers (I–K). See also Figure S2. See STAR Methods for detailed description of genomics analyses. Datasets used in this figure are listed in Table S4.
Figure 3
Figure 3. YY1 Can Enhance DNA Interactions In Vitro
(A and D) Models depicting the in vitro DNA circularization assays used to detect the ability of YY1 to enhance DNA looping interactions with no motif control (A) or competitor DNA control (D). (B and E) Results of the in vitro DNA circularization assay visualized by gel electrophoresis with no motif control (B) or competitor DNA control (E). The dominant lower band reflects the starting linear DNA template, while the upper band corresponds to the circularized DNA ligation product. (C and F) Quantifications of DNA template circularization as a function of incubation time with T4 DNA ligase for no motif control (C) or competitor DNA control (F). Values correspond to the percent of DNA template that is circularized and represents the mean and SD of four experiments. See also Figure S3.
Figure 4
Figure 4. Deletion of YY1 Binding Sites Causes Loss of Enhancer-Promoter Interactions
(A) Model depicting CRISPR/Cas9-mediated deletion of a YY1 binding motif in the regulatory region of a gene. (B and C) CRISPR/Cas9-mediated deletion of YY1 binding motifs in the regulatory regions of two genes, Raf1 (B) and Etv4 (C), was performed, and the effects on YY1 occupancy, enhancer-promoter looping, and mRNA levels were measured. The positions of the targeted YY1 binding motifs, the genotype of the wild-type and mutant lines, and the 4C sequencing (4C-seq) viewpoint are indicated. The mean 4C-seq signal is represented as a line (individual replicates are shown in Figure S4), and the shaded area represents the 95% confidence interval. Three biological replicates were assayed for 4C-seq and ChIP-qPCR experiments, and six biological replicates were assayed for RT-qPCR experiments. Error bars represent the SD. All p values were determined using the Student’s t test. See also Figure S4. See STAR Methods for detailed description of genomics analyses. Datasets used in this figure are listed in Table S4.
Figure 5
Figure 5. Depletion of YY1 Disrupts Gene Expression
(A) Model depicting dTAG system used to rapidly deplete YY1 protein. (B) Western blot validation of knockin of FKBP degron tag and ability to inducibly degrade YY1 protein. (C) Change in gene expression (log2 fold change) upon degradation of YY1 for all genes plotted against the expression in untreated cells. Genes that displayed significant changes in expression (false discovery rate [FDR] adjusted p value <0.05) are colored with upregulated genes plotted in red and downregulated genes plotted in blue. (D) Heatmaps displaying the change in expression of each gene upon degradation of YY1 and wild-type YY1 ChIP-seq signal in a ±2-kb region centered on the transcription start site (TSS) of each gene. Each row represents a single gene, and genes are ranked by their adjusted p value for change in expression upon YY1 degradation. (E) Model depicting experimental outline to test the effect of YY1 degradation on embryonic stem cell differentiation into the three germ layers via embryoid body formation from untreated cells (YY1+) and cells treated with dTAG compound to degrade YY1 (YY1). (F) Microscopy images of embryoid bodies formed from YY1+ and YY1 cells. (G) Immunohistochemistry images of embryoid bodies formed from YY1+ and YY1 cells. GATA4 is displayed in green, and DNA stained using DAPI is displayed in blue. The scale bar represents 50 μm. (H) Quantification of single-cell RNA-seq results for embryoid bodies formed from YY1+ and YY1 cells. The percentage of cells expressing various differentiation-specific genes is displayed for YY1+ and YY1 embryoid bodies. See also Table S2, Table S3, and Figure S5. See STAR Methods for detailed description of genomics analyses. Datasets used in this figure are listed in Table S4.
Figure 6
Figure 6. Depletion of YY1 Disrupts Enhancer-Promoter Looping
(A) Scatterplot displaying for all YY1-YY1 enhancer-promoter interactions the change in normalized interaction frequency (log2 fold change) upon degradation of YY1, as measured by H3K27ac HiChIP, and plotted against the normalized interaction frequency in untreated cells. (B) Change in normalized interaction frequency (log2 fold change) upon degradation of YY1 for three different classes of interactions: all interactions, interactions not associated with YY1 ChIP-seq peaks, and YY1-YY1 enhancer-promoter interactions. (C) Scatterplot displaying for each gene associated with a YY1-YY1 enhancer-promoter interaction the change in gene expression (log2 fold change) upon degradation of YY1 plotted against the expression in untreated cells. Genes that showed significant changes in expression (FDR adjusted p value <0.05) are colored with upregulated genes plotted in red and downregulated genes plotted in blue. (D and E) Effect of YY1 degradation at the Slc7a5 locus (D) and Klf9 locus (E) on enhancer-promoter interactions and gene expression. The top of each panel shows an arc representing an enhancer-promoter interaction detected in the HiChIP data. Signal in the outlined pixels was used to quantify the change in normalized interaction frequency upon YY1 degradation. Three biological replicates were assayed per condition for H3K27ac HiChIP, and two biological replicates were assayed for RNA-seq. Error bars represent the SD. p values for HiChIP were determined using the Student’s t test. p values for RNA-seq were determined using a Wald test. See also Figure S6. See STAR Methods for detailed description of genomics analyses. Datasets used in this figure are listed in Table S4.
Figure 7
Figure 7. Rescue of Enhancer-Promoter Interactions in Cells
(A) Model depicting use of dCas9-YY1 to artificially tether YY1 to a site adjacent to the YY1 binding site mutation in the promoter-proximal region of Etv4 in order to determine whether artificially tethered YY1 can rescue enhancer-promoter interactions. (B) Model depicting dCas9-YY1 rescue experiments. Etv4 promoter-proximal YY1 binding motif mutant cells were transduced with lentivirus to stably express either dCas9 or dCas9-YY1, and two sgRNAs to direct their localization to the sequences adjacent to the deleted YY1 binding motif in the Etv4 promoter-proximal region. The ability to rescue enhancer-promoter looping was assayed by 4C-seq. (C) Western blot results showing that Etv4 promoter-proximal YY1 binding motif mutant cells transduced with lentivirus to stably express either dCas9 or dCas9-YY1 successfully express dCas9 or dCas9-YY1. (D) Artificial tethering of YY1 using dCas9-YY1 was performed at sites adjacent to the YY1 binding site mutation in the promoter-proximal region of Etv4. The effects of tethering YY1 using dCas9-YY1 on enhancer-promoter looping and expression of the Etv4 gene were measured and compared to dCas9 alone. The genotype of the Etv4 promoter-proximal YY1 binding motif mutant cells and the 4C-seq viewpoint (VP) is shown. The 4C-seq signal is displayed as the smoothed average reads per million per base pair. The mean 4C-seq signal is represented as a line, and the shaded area represents the 95% confidence interval. Three biological replicates were assayed for 4C-seq and CAS9 ChIP-qPCR experiments, and six biological replicates were assayed for RT-qPCR experiments. Error bars represent the SD. All p values were determined using the Student’s t test. (E) Model depicting the loss of looping interactions after the inducible degradation of the structuring factors CTCF and YY1 followed by restoration of looping upon washout of degradation compounds. (F) Change in normalized interaction frequency (log2 fold change) after YY1 and CTCF degradation (treated) and recovery (washout) relative to untreated cells. For YY1 degradation, change in normalized interaction frequency is plotted for YY1-YY1 enhancer-promoter interactions. For CTCF degradation, change in normalized interaction frequency is plotted for CTCF-CTCF interactions. See also Figure S7. See STAR Methods for detailed description of genomics analyses. Datasets used in this figure are listed in Table S4.

Comment in

References

    1. Adhya S. Multipartite genetic control elements: Communication by DNA loop. Annu Rev Genet. 1989;23:227–250. - PubMed
    1. Allen BL, Taatjes DJ. The Mediator complex: A central integrator of transcription. Nat Rev Mol Cell Biol. 2015;16:155–166. - PMC - PubMed
    1. Amoutzias GD, Robertson DL, Van de Peer Y, Oliver SG. Choose your partners: Dimerization in eukaryotic transcription factors. Trends Biochem Sci. 2008;33:220–229. - PubMed
    1. Arnold R, Burcin M, Kaiser B, Muller M, Renkawitz R. DNA bending by the silencer protein NeP1 is modulated by TR and RXR. Nucleic Acids Res. 1996;24:2640–2647. - PMC - PubMed
    1. Baniahmad A, Steiner C, Köhne AC, Renkawitz R. Modular structure of a chicken lysozyme silencer: involvement of an unusual thyroid hormone receptor binding site. Cell. 1990;61:505–514. - PubMed