. 2017 Dec 14;171(7):1638-1648.e7.
doi: 10.1016/j.cell.2017.11.014. Epub 2017 Dec 7.

Structural Basis for Regulated Proteolysis by the α-Secretase ADAM10

Affiliations

Structural Basis for Regulated Proteolysis by the α-Secretase ADAM10

Tom C M Seegar et al. Cell. .

Abstract

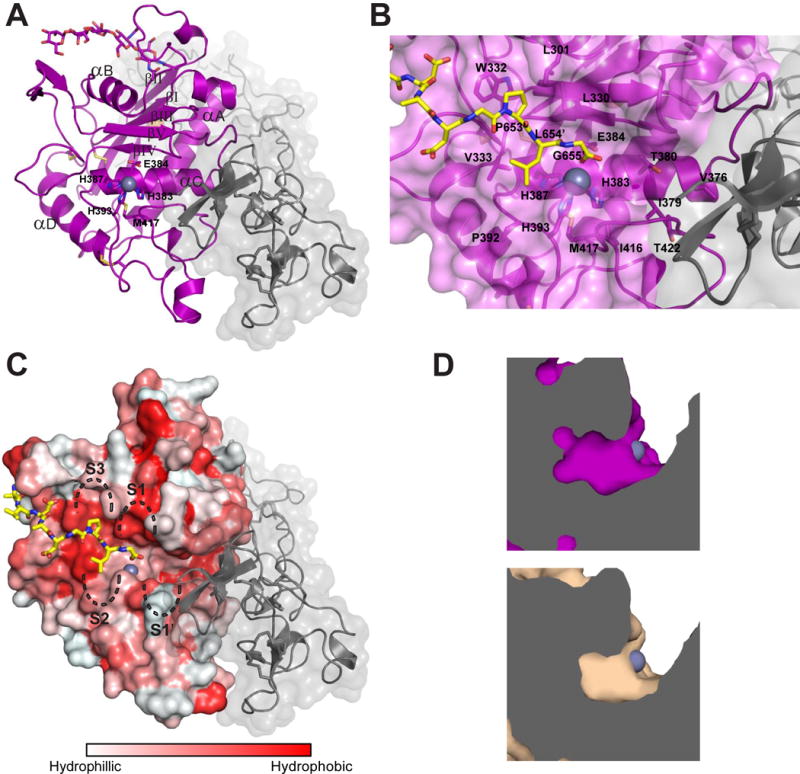
Cleavage of membrane-anchored proteins by ADAM (a disintegrin and metalloproteinase) endopeptidases plays a key role in a wide variety of biological signal transduction and protein turnover processes. Among ADAM family members, ADAM10 stands out as particularly important because it is both responsible for regulated proteolysis of Notch receptors and catalyzes the non-amyloidogenic α-secretase cleavage of the Alzheimer's precursor protein (APP). We present here the X-ray crystal structure of the ADAM10 ectodomain, which, together with biochemical and cellular studies, reveals how access to the enzyme active site is regulated. The enzyme adopts an unanticipated architecture in which the C-terminal cysteine-rich domain partially occludes the enzyme active site, preventing unfettered substrate access. Binding of a modulatory antibody to the cysteine-rich domain liberates the catalytic domain from autoinhibition, enhancing enzymatic activity toward a peptide substrate. Together, these studies reveal a mechanism for regulation of ADAM activity and offer a roadmap for its modulation.

Keywords: ADAM10; Notch signaling; X-ray crystallography; amyloid precursor protein.


Figures

Figure 1
Figure 1
ADAM10 Structural Overview. A) Architecture and domain organization. Left panel depicts a schematic of the ADAM10 protein colored by domain. SS: signal sequence; Pro: prodomain; M: metalloproteinase; D: disintegrin; C: cysteine-rich; TM: transmembrane; Cyt; cytoplasmic tail. The red box encompasses the portion of the protein visualized in the X-ray structure. Right panel shows the overall architecture of the mature human ADAM10 ectodomain, colored according to the domain schematic in cartoon representation. The catalytic zinc ion is gray, and a bound calcium ion is shown in orange. Cysteine residues engaged in disulfide bonds are shown as sticks. B) Superposition of ADAM22 (pdb ID code 3G5C) on ADAM10. Proteins are shown in cartoon representation. ADAM10 is colored gray, and ADAM22 domains are colored with the metalloprotease domain magenta, disintegrin domain cyan, cysteine-rich domain green, and EGF-like domain red. ADAM22 calcium ions are colored orange. See also Supplementary Figures S1 and S2.
Figure 2
Figure 2
Structural analysis of the ADAM10 catalytic site. A) Overview of the active site. The metalloproteinase domain is shown in cartoon representation, and the disintegrin and cysteine-rich regions are shown as a gray cartoon with a transparent surface. Key residues at the ADAM10 active site are shown as sticks, and the zinc ion is shown as a gray sphere. Residues 647-655 have been removed for clarity. B) Close-up view, showing C-terminal residues 647-655 of the adjacent subunit bound in the active site. The metalloproteinase domain is shown in magenta as a transparent molecular surface, with residues contacting the bound product mimic shown as sticks in CPK colors. The C-terminal region of the adjacent subunit is shown as sticks using CPK colors and carbon atoms in yellow. Peptide labels are indicated with a prime mark to distinguish them from labeled active site residues. C) Molecular surface representation. The hydrophobicity of the catalytic domain is shown on a sliding scale from white (polar) to red (hydrophobic). The disintegrin and cysteine-rich regions and the C-terminus of the adjacent subunit are shown as in panels A and B, respectively. The side-chain binding pockets on the enzyme (for S3 – S1′) are indicated with dashed lines. D) S1′ binding pocket and comparison to ADAM17. The pockets (magenta and beige for ADAM10 and ADAM17, respectively) are viewed as surfaces from “inside” the protein, with the transected protein region shown in gray.
Figure 3
Figure 3
Analysis of ADAM10 Conservation and Autoregulation. A) Conservation analysis shown in an “open book” view. Sequence conservation scores determined using Consurf (Ashkenazy et al., 2016) were mapped onto the surface representation of the ADAM10 ectodomain (middle panel), and onto open book views of the individual D+C (left panel) and metalloprotease (right panel) domains. Conservation scores are colored on a sliding scale from maroon (highest conserved) to teal (least conserved). B) Contact interface analysis. Surface representation of the ADAM10 ectodomain (middle panel) alongside open book views of the individual D+C (left panel) and metalloproteinase (right panel) domains. Domains are colored as in Figure 1 with residues at the contact interface colored a darker shade. C) Surface representation of the bovine ADAM10 D+C domains (cyan and green, respectively) in complex with the modulatory 8C7 Fab (beige, PDB: 5L0Q). Residues at the contact interface are colored in a darker shade. D) Superposition of the human ADAM10 ectodomain onto the bovine D+C domain complex with the 8C7 Fab. The 8C7 Fab is shown as a transparent surface and the human ADAM10 ectodomain is shown in cartoon representation. The steric clash that would occur between the Fab and the ADAM10 catalytic domain is denoted with a dashed oval. E) Modulation of ADAM10 catalytic activity by the 8C7 Fab. Plots showing hydrolysis of a fluorogenic peptide by purified ADAM10 ectodomain in the presence of increasing concentrations of the 8C7 and 11G2 antibodies are shown. Steady state catalytic rates were plotted as an average of n=3 measurements for each antibody concentration.
Figure 4
Figure 4
Notch1 and APP Processing by ADAM10. A) Schematic representation of the different ADAM10 constructs used in Notch and APP processing assays. B) Notch1-dependent luciferase reporter activity in co-culture assays. U2OS cells transfected with the forms of ADAM10 schematically represented in panel (A) were co-cultured with MS5 cells alone (-DLL4) or with MS5 cells stably expressing human DLL4. C) Notch1-dependent luciferase reporter activity of Notch-expressing U2OS cells co-cultured with DLL4-expressing cells transefected with either ΔMP-ADAM10 or ΔMP-ADAM17. D) APP shedding assay. Cells transfected with both epitope-tagged APP (FLAG-APP-HA) and the indicated forms of ADAM10 were analyzed by Western blot with anti-FLAG and anti-HA antibodies. APP shed into the media was detected with the anti-FLAG antibody, and APP present in the lysate was detected with anti-HA. The amount of material loaded into each lane was normalized by cell number and assessed by Western blot analysis using an anti-GAPDH antibody. In panels B and C, histograms represent the average of three independent transfections with measurements made in triplicate. Statistical analysis was performed using ANOVA, and a Dunnett’s multiple comparison post hoc test was performed comparing test samples to the control. *p <0.05. See Also Supplementary Figure S3.
Figure 5
Figure 5
Notch1 signaling requires ADAM10 in cis in U2OS cells. A) Relative Notch1-dependent luciferase reporter activity in U2OS ADAM10+/+ or U2OS ADAM10−/− cells co-cultured with MS5 cells alone (-) or MS5 cells stably expressing DLL4 (+). Addition of ADAM10 (+) to ADAM10−/− U2OS cells restores Notch1-dependent reporter activity when co-cultured with MS5-DLL4 cells. B, C) Co-culture assay adapted for use with U2OS as both the Notch1-expressing and DLL4-expressing cell. Parental or ADAM10 null U2OS cell identity (10+/+ or 10−/−) for ligand and receptor cells, and DLL4 transfection state of the sending cells are indicated below the bar graph. In panel (C), assays in which ADAM10−/− cells were transfected with ADAM10 are indicated below the graph as +A10. Histograms represent the average of three independent transfections with measurements made in triplicate. Statistical analysis was performed using ANOVA, and a Dunnett’s multiple comparison post hoc test was performed comparing test samples to the control. *p <0.05.
Figure 6
Figure 6
Speculative model for ADAM10-mediated cleavage of Notch receptors. Notch receptors are quiescent in the absence of ligand, with the ADAM10 cleavage site of the receptor masked in a closed conformation (NotchOff). ADAM10 likewise favors a closed, autoinhibited (EClosed) conformation over an open one (EOpen) that would allow unrestricted access of substrate to the active site. Ligands activate Notch receptors by supplying mechanical force, revealing the ADAM10 processing site (IEA*VQS, site of cleavage indicated with an asterisk) in the Notch receptor (NotchOn), and enabling engagement of NotchOn by the active site of the open form of ADAM10 (red arrow). The opening of Notch and ADAM10 dramatically lowers the activation barrier for ADAM10-catalyzed Notch proteolysis (ES). It is also possible that the D+C region of ADAM10 directly contacts NotchOn to stabilize both proteins in their open conformations and promote cleavage (dashed red lines). ADAM10 hydrolysis of Notch releases an S2-processed Notch receptor (P), that is a substrate for further proteloytic processing by γ–secretase.

References

    1. Afonine PV, Grosse-Kunstleve RW, Echols N, Headd JJ, Moriarty NW, Mustyakimov M, Terwilliger TC, Urzhumtsev A, Zwart PH, Adams PD. Towards automated crystallographic structure refinement with phenix.refine. Acta Crystallogr D Biol Crystallogr. 2012;68:352–367. - PMC - PubMed
    1. Andrawes MB, Xu X, Liu H, Ficarro SB, Marto JA, Aster JC, Blacklow SC. Intrinsic selectivity of Notch 1 for Delta-like 4 over Delta-like 1. J Biol Chem. 2013;288:25477–25489. - PMC - PubMed
    1. Arduise C, Abache T, Li L, Billard M, Chabanon A, Ludwig A, Mauduit P, Boucheix C, Rubinstein E, Le Naour F. Tetraspanins regulate ADAM10-mediated cleavage of TNF-alpha and epidermal growth factor. J Immunol. 2008;181:7002–7013. - PubMed
    1. Ashkenazy H, Abadi S, Martz E, Chay O, Mayrose I, Pupko T, Ben-Tal N. ConSurf 2016: an improved methodology to estimate and visualize evolutionary conservation in macromolecules. Nucleic Acids Res. 2016;44:W344–350. - PMC - PubMed
    1. Aster JC, Pear WS, Blacklow SC. The Varied Roles of Notch in Cancer. Annu Rev Pathol. 2017;12:245–275. - PMC - PubMed

MeSH terms