. 2017 Dec 18;27(24):3812-3825.e3.
doi: 10.1016/j.cub.2017.11.022. Epub 2017 Dec 7.

Vagus Motor Neuron Topographic Map Determined by Parallel Mechanisms of hox5 Expression and Time of Axon Initiation

Affiliations

Vagus Motor Neuron Topographic Map Determined by Parallel Mechanisms of hox5 Expression and Time of Axon Initiation

Gabrielle R Barsh et al. Curr Biol. .

Abstract

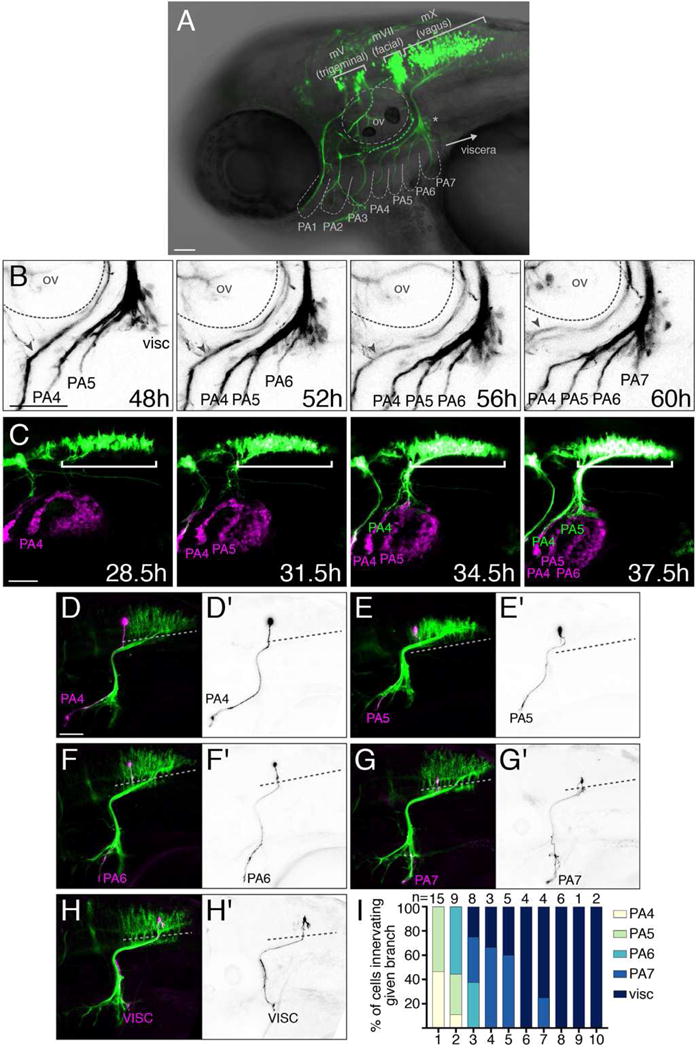
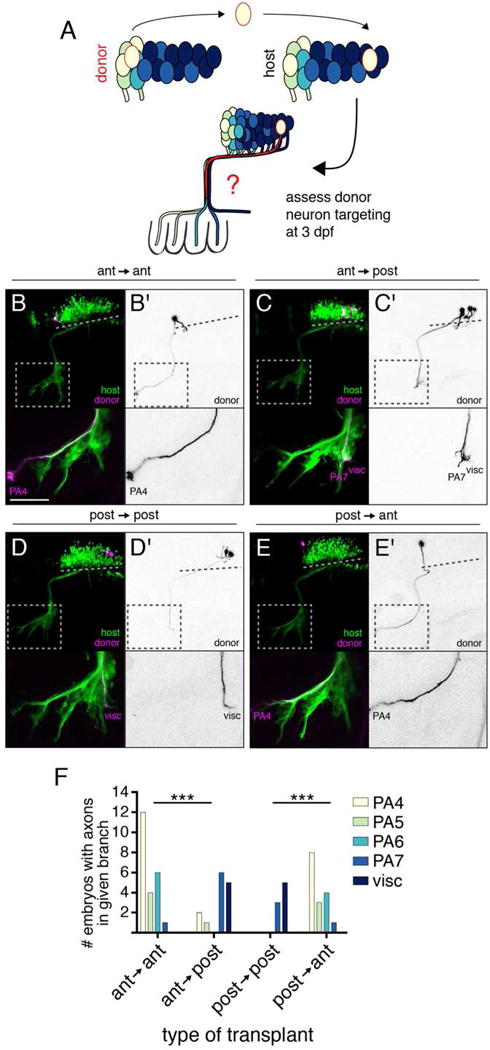
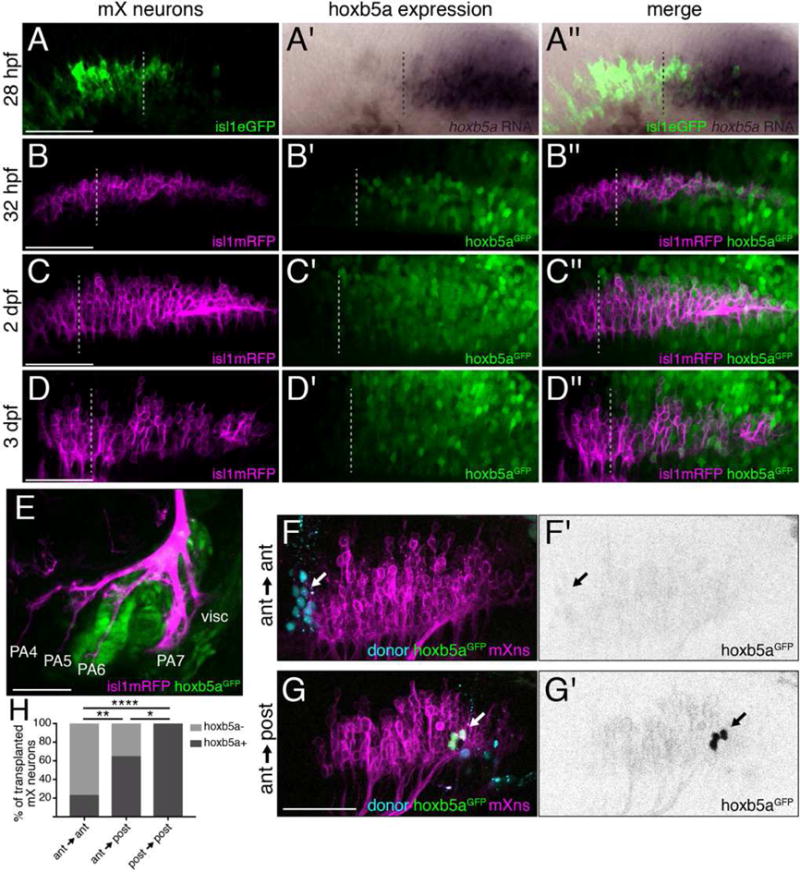
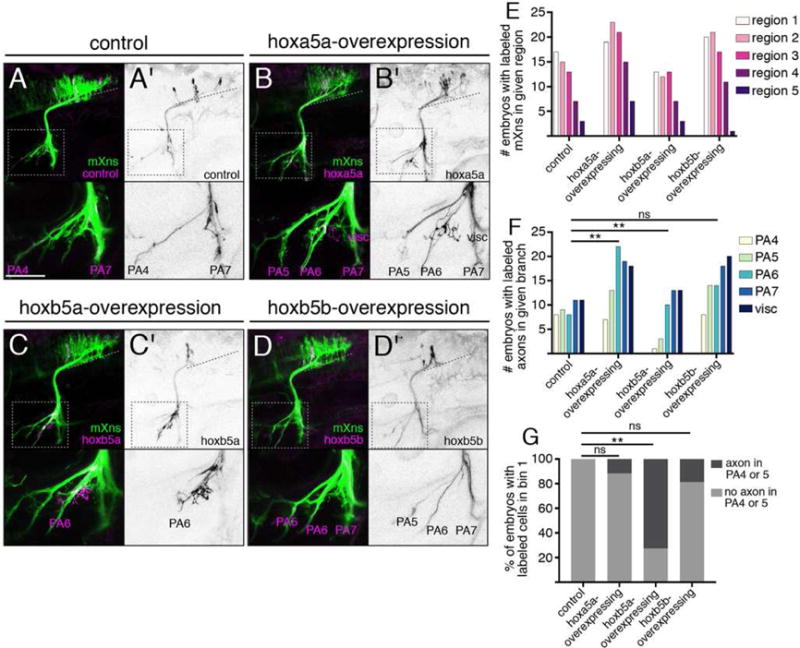
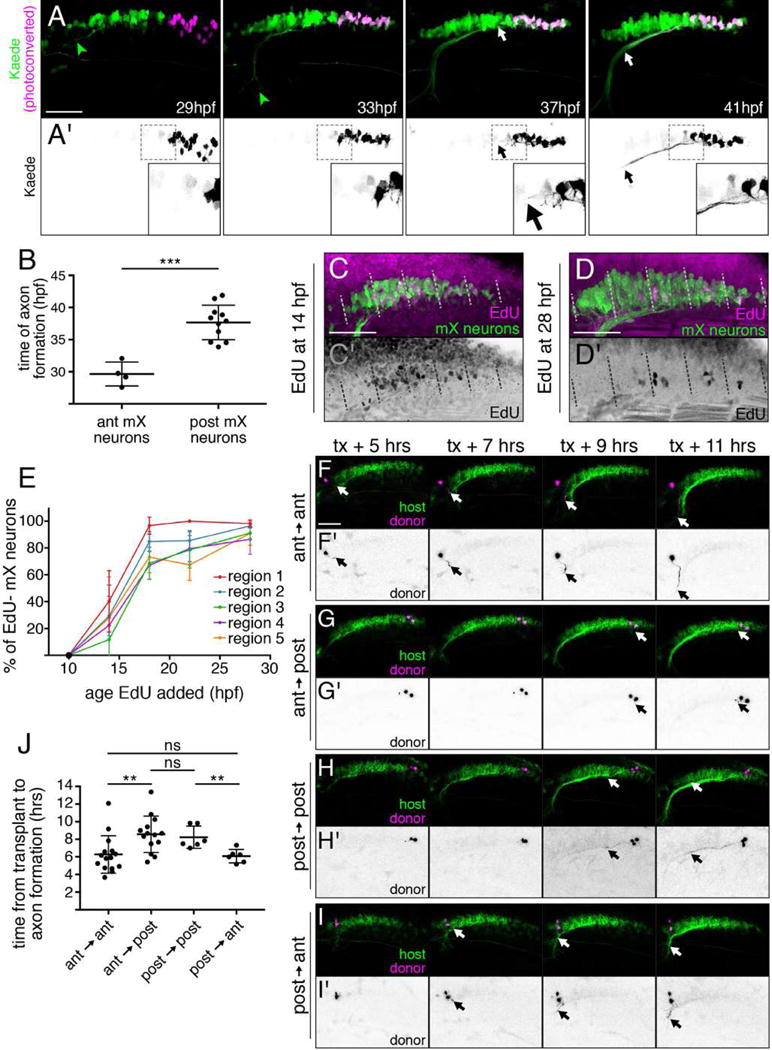
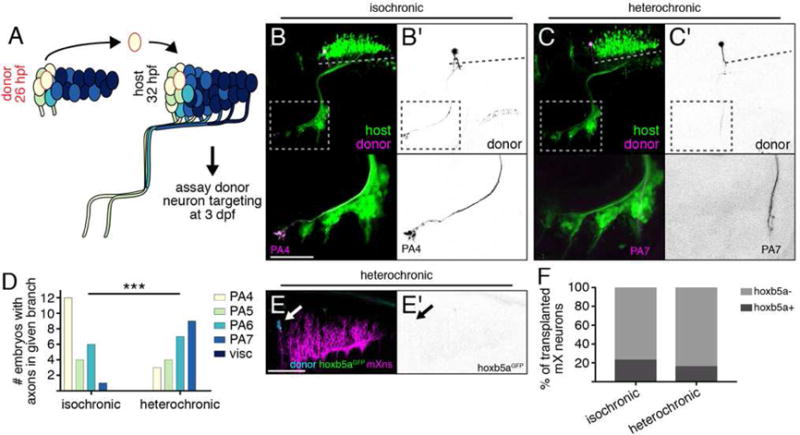
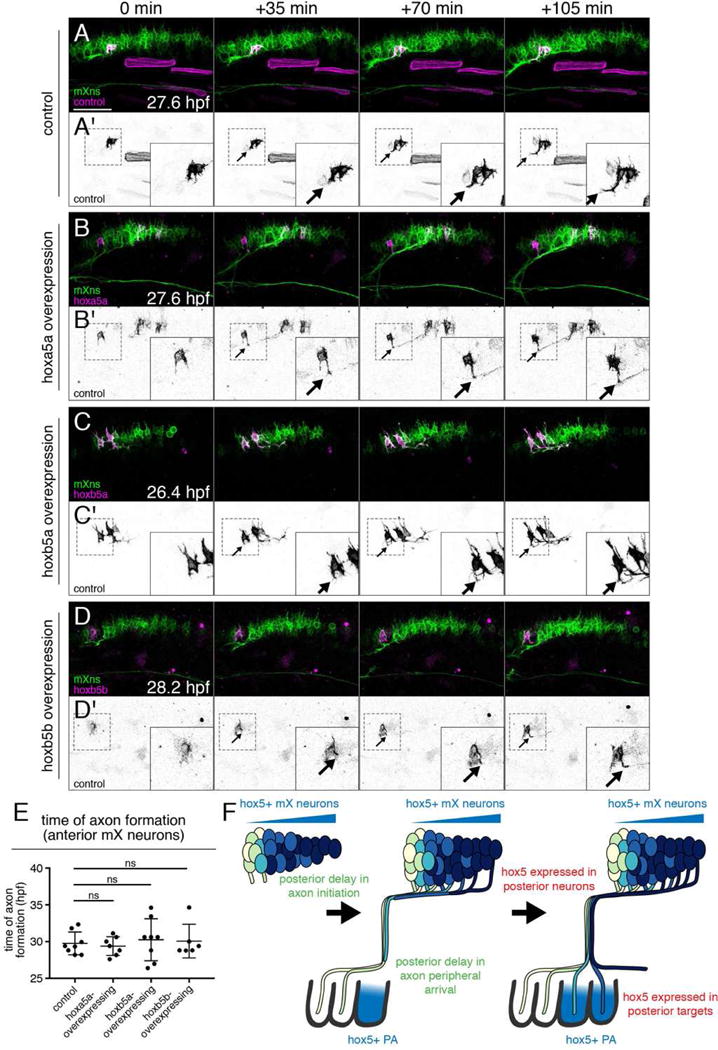
Many networks throughout the nervous system are organized into topographic maps, where the positions of neuron cell bodies in the projecting field correspond with the positions of their axons in the target field. Previous studies of topographic map development show evidence for spatial patterning mechanisms, in which molecular determinants expressed across the projecting and target fields are matched directly in a point-to-point mapping process. Here, we describe a novel temporal mechanism of topographic map formation that depends on spatially regulated differences in the timing of axon outgrowth and functions in parallel with spatial point-to-point mapping mechanisms. We focus on the vagus motor neurons, which are topographically arranged in both mammals and fish. We show that cell position along the anterior-posterior axis of hindbrain rhombomere 8 determines expression of hox5 genes, which are expressed in posterior, but not anterior, vagus motor neurons. Using live imaging and transplantation in zebrafish embryos, we additionally reveal that axon initiation is delayed in posterior vagus motor neurons independent of neuron birth time. We show that hox5 expression directs topographic mapping without affecting time of axon outgrowth and that time of axon outgrowth directs topographic mapping without affecting hox5 expression. The vagus motor neuron topographic map is therefore determined by two mechanisms that act in parallel: a hox5-dependent spatial mechanism akin to classic mechanisms of topographic map formation and a novel axon outgrowth-dependent temporal mechanism in which time of axon formation is spatially regulated to direct axon targeting.

Keywords: axogenesis; axon initiation; branchiomotor neuron; hoxa5; hoxb5; topographic map; vagus; vagus motor neuron; zebrafish.


Figures

Figure 1
Figure 1. Topographic mapping by vagus motor neurons
(A) Lateral view of a zebrafish embryo expressing Tg(isl1:Kaede) at 3 dpf. Brackets: cranial motor nuclei; PA: pharyngeal arches; ov: otic vesicle. Asterisk marks a subset of vagus sensory cells labeled by islet1. (B) mX axon branches innervate PAs sequentially. See Movie S1. Gray arrowhead indicates the glossopharyngeal motor nerve (mIX). (C) tcf21:mCherry+ PA muscle precursors (magenta) appear sequentially prior to mX axon entry. White bracket indicates mX nucleus expressing isl1:eGFPCAAX (green). See Movie S2. (D–H) mX neurons are arranged in a topographic map. Single neuron labeled by Tg(isl1:eGFPCAAX) in magenta or black-on-white (D′–H′) on Tg(isl1:mRFP) background (green). Dotted lines indicate the length of the mX territory. (I) Quantification of (D–H). mX territory was divided into 10 equal-length bins along the A-P axis. In all figures, anterior is left and dorsal is up. Scale bars are 50 μm. See also Figure S1.
Figure 2
Figure 2. Vagus motor neuron position determines axon target
(A) Schematic of postmitotic neuron transplantation approach. mX neurons are transplanted homotopically or heterotopically (pictured) before axon formation and donor axon targeting is assayed at 3 dpf. (B–E) Examples of homotopic (B,D) and heterotopic (C,E) transplants. Donor-derived neurons are marked by Tg(isl1:Kaede) in magenta and black-on-white (B′–E′). Host motor neurons are marked by Tg(isl1:GFP) in green. Dotted lines indicate length of mX territory, dotted boxes indicate region shown in lower panels. (F) Quantification of transplant results showing number of host embryos with a donor axon in a given branch. Statistical analysis done with Fisher’s exact test (see STAR Methods for details). Ant → ant n = 14 host embryos; ant → post n = 12; post → post n = 7; post → ant n = 12.
Figure 3
Figure 3. hox5 expression distinguishes anterior and posterior mX neurons
(A) hoxb5a is expressed in the posterior mX territory. RNA in situ hybridization of 28 hpf embryo for hoxb5a expression (purple) followed by immunostaining against Tg(isl1:eGFPCAAX) to label motor neurons (green). Dotted lines in (A–D) indicate anterior limit of hoxb5a expression. See also Figure S2. (B–E) hoxb5aGFP is expressed in posterior mX neurons, PA6, and PA7. hoxb5aGFP (green) and Tg(isl1:mRFP) (magenta) at 32 hpf (B), 2 dpf (C), or 3 dpf (D,E). (F,G) Anterior mX neurons marked by lineage dye (cyan) and isl1:mRFP (magenta) transplanted homotopically (F) or heterotopically (G) are hoxb5aGFP-negative (arrow in F) or hoxb5aGFP-positive, respectively (arrow; green in G, black in G′). Host motor neurons express Tg(isl1:mRFP) (magenta). (H) quantification of (F,G). Analysis done by Fisher’s exact test. Ant → ant n = 22 neurons, 6 embryos; ant → post n = 28 neurons, 9 embryos; post → post n = 13 neurons, 5 embryos.
Figure 4
Figure 4. hox5 expression directs mX axons to posterior targets
(A–D) Expression of control isl1:eGFPCAAX (A) or isl1:hox5-P2A-eGFPCAAX expression construct (B–D) (magenta and (A′–D′) black) in a Tg(isl1:mRFP) background (green). Dotted lines indicate length of mX territory, dotted boxes indicate region shown in bottom panels. (E) Quantification of distribution of labeled neurons after hox5 expression as in (A–D). Regions are based on morphological boundaries as in Figure S1. (F) Quantification of labeled axon targeting in (A–D). Analysis was done using Fisher’s exact test comparing control to each ectopic expression condition with respect to each axon branch. Conditions are considered different if they differ in at least one branch. In both (E) and (F), control n = 17 embryos, hoxa5a n = 24, hoxb5a n = 20, hoxb5b n = 28. (G) Analysis of axon targeting in cases where a labeled mX neuron was located within the most anterior region of the mX territory (bin 1, see Figure 1I). Ectopic hoxb5a-expressing mX neurons in bin 1 avoid PA4 and PA5. Analysis done by Chi-square followed by Fisher’s exact test comparing each hox5 construct to control. Control n = 9 embryos, hoxa5a n = 17, hoxb5a n = 11 embryos, hoxb5b n = 16.
Figure 5
Figure 5. Time of axon formation and arrival in the head periphery is delayed in posterior mX neurons independent of birthdate
(A) Stills from representative time lapse (see Movie S3) of embryo expressing Tg(isl1:Gal4);Tg(UAS:kaede). Photoconverted posterior mX neurons (magenta (A) or black (A′), white arrow) initiate axons 8 hours after anterior mX neurons (green, green arrowhead). (B) Quantification of (A). Each point represents a single embryo. Analysis done by unpaired t test. (C,D) Embryo expressing Tg(isl1:GFP) (green) was incubated in EdU (magenta and (C′,D′) black) to label cells born after 14 hpf (C) or 28 hpf (D). Embryos were fixed at 48 hpf and the mX territory was divided into 5 equal-length regions from anterior (1) to posterior (5). (E) Quantification of (C,D) showing percentage of postmitotic (EdU) mX neurons (isl1:GFP+) in each region at each time point ([# EdUGFP+ cells]/[# GFP+ cells]). Each point represents mean; error bars show standard deviation. n = 5 embryos for all time points except 14 hpf, where n = 4 embryos. (F–I) Transplanting an anterior mX neuron heterotopically into the posterior delays axon formation (F,G) while transplanting a posterior mX neuron into the anterior hastens axon formation (H,I). Donor neurons marked by Tg(isl1:kaede) in magenta and (F′–I′) black, and host neurons marked by Tg(isl1:mRFP) in green. See also Movies S4, S5. (J) Quantification of (F–I). Each point represents a single embryo. Analysis done by unpaired t test.
Figure 6
Figure 6. Time of mX axon outgrowth determines peripheral target independently of hox5 expression
(A) mX neurons are transplanted from anterior to anterior (homotopic) from a 26 hpf donor to a 32 hpf host, and donor axon targeting is assayed at 3 dpf. (B,C) Anterior mX neurons transplanted isochronically (B) innervate anterior targets while anterior mX neurons transplanted heterochronically (C) innervate posterior targets. Donor neurons are marked by Tg(isl1:Kaede) (magenta or (B′,C′) black). Host motor neurons are marked by Tg(isl1:GFP) (green). Dotted lines indicate length of mX territory. Dotted boxes indicate region shown in bottom panels. (D) Quantification of transplant results. Isochronic control transplants are the same data shown in Figure 2F (anterior → anterior). Analysis done using Fisher’s exact test, see STAR Methods for details. Isochronic n = 14 host embryos, heterochronic n = 16. (E) Change in targeting after heterochronic transplantation is not due to induction of hox5 expression. Transgenes are as described in Fig. 3F,G (F) Quantification of (E). Isochronic control transplants are the same data shown in Figure 3F. Heterochronic n = 19 cells, 11 embryos.
Figure 7
Figure 7. hox5 acts independently of time of axon formation
(A–D) hox5 expression does not delay the time of axon formation in anterior mX neurons. Stills from representative time lapses of control (A) or ectopic hox5-expressing (B–D) mX neurons (magenta or black in A′–D′) in a Tg(isl1:mRFP) background (green). Arrows indicate the emerging axon. See Movies S6–S9. (E) Quantification of (A–D). Each point represents a single embryo. Analysis done by unpaired t test. (F) Model of dual mechanisms governing mX neuron topographic map development. Anterior mX neurons arrive in the head periphery when only anterior PAs are available for innervation. Delayed axon initiation in posterior mX neurons results in delayed arrival in the periphery when posterior PAs have formed. Additionally, hox5 genes are expressed in posterior mX neurons and bias their axons towards posterior, hox5-expressing PAs.

Comment in

References

    1. Cang J, Feldheim DA. Developmental Mechanisms of Topographic Map Formation and Alignment. Annu Rev Neurosci. 2013;36:51–77. - PubMed
    1. Triplett JW, Feldheim DA. Eph and ephrin signaling in the formation of topographic maps. Semin Cell Dev Biol. 2012;23:7–15. - PMC - PubMed
    1. Sperry RW. Chemoaffinity in the orderly growth of nerve fiber patterns and connections. Proc Natl Acad Sci U S A. 1963;50:703–10. - PMC - PubMed
    1. Cheng HJ, Nakamoto M, Bergemann AD, Flanagan JG. Complementary gradients in expression and binding of ELF-1 and Mek4 in development of the topographic retinotectal projection map. Cell. 1995;82:371–381. - PubMed
    1. Drescher U, Kremoser C, Handwerker C, Löschinger J, Noda M, Bonhoeffer F. In vitro guidance of retinal ganglion cell axons by RAGS, a 25 kDa tectal protein related to ligands for Eph receptor tyrosine kinases. Cell. 1995;82:359–370. - PubMed

MeSH terms

LinkOut - more resources