Review
. 2017;93(10):772-801.
doi: 10.2183/pjab.93.049.

What do eye movements tell us about patients with neurological disorders? - An introduction to saccade recording in the clinical setting

Affiliations
Review

What do eye movements tell us about patients with neurological disorders? - An introduction to saccade recording in the clinical setting

Yasuo Terao et al. Proc Jpn Acad Ser B Phys Biol Sci. 2017.

Abstract

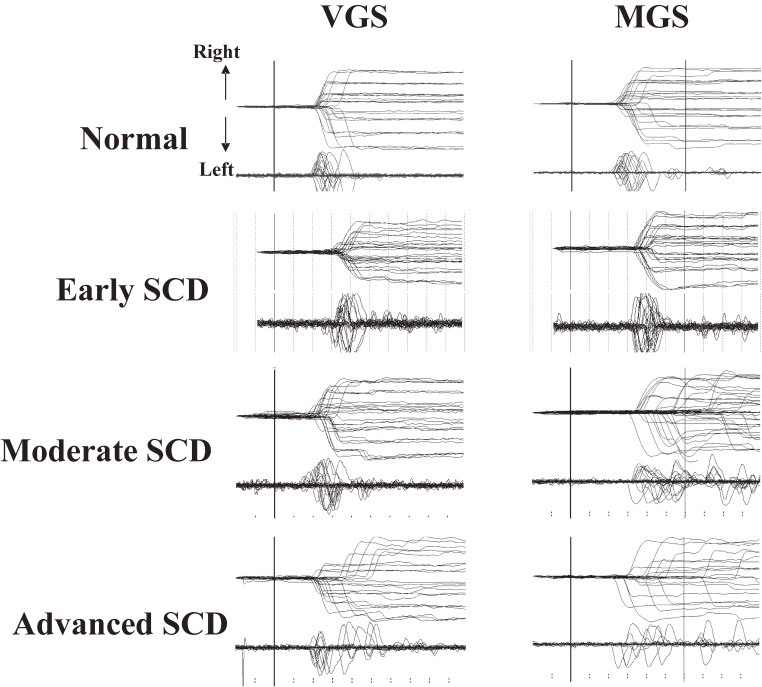
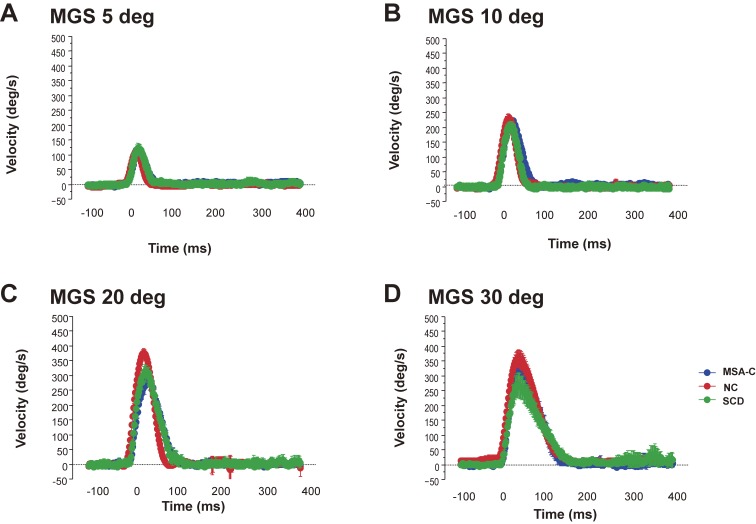
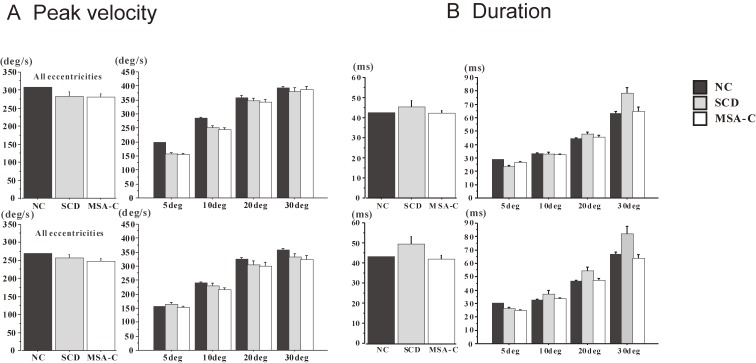
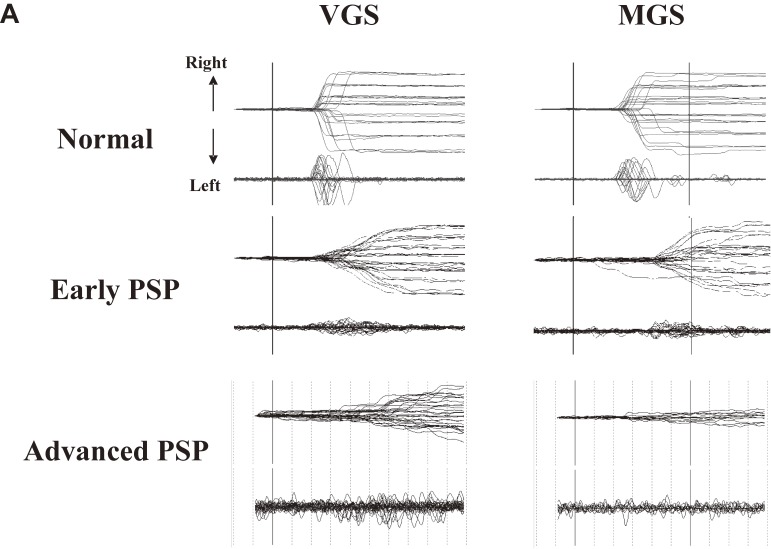
Non-invasive and readily implemented in the clinical setting, eye movement studies have been conducted extensively not only in healthy human subjects but also in patients with neurological disorders. The purpose of saccade studies is to "read out" the pathophysiology underlying neurological disorders from the saccade records, referring to known primate physiology. In the current review, we provide an overview of studies in which we attempted to elucidate the patterns of saccade abnormalities in over 250 patients with neurological disorders, including cerebellar ataxia and brainstem pathology due to neurodegenerative disorders, and what they tell about the pathophysiology of patients with neurological disorders. We also discuss how interventions, such as deep brain stimulation, affect saccade performance and provide further insights into the workings of the oculomotor system in humans. Finally, we argue that it is important to understand the functional significance and behavioral correlate of saccade abnormalities in daily life, which could require eye tracking methodologies to be performed in settings similar to daily life.

Keywords: ataxia; basal ganglia; cerebellum; cerebral cortex; parkinsonism; saccade.


Figures

Figure 1.
Figure 1.
Typical setup for recording an electrooculogram. A. For recording horizontal saccades, electrodes are placed at the bilateral outer canthi, whereas for recording vertical saccades, electrodes are placed above and below one eye. B. Subjects are seated in front of a black, concave, dome-shaped screen measuring 90 cm in diameter that contains light-emitting diodes embedded in pinholes, which serve as the fixation points and saccade targets. The subject holds a microswitch button connected to the microcomputer, allowing the subject to initiate and terminate a task trial by pressing and releasing the button. The target point is turned on at a random location 5, 10, 20, or 30 degrees horizontally to the left or right of the central fixation point.
Figure 2.
Figure 2.
Oculomotor tasks used in clinical saccade studies. A. Visually guided saccade (VGS), B. Memory-guided saccade (MGS). Reproduced with permission and modified from Terao et al.96)
Figure 3.
Figure 3.
Example of saccade records in a normal subject. A. Saccades records of visually guided saccade (VGS). B. Memory-guided saccade (MGS). A total of 25 VGS and MGS traces are superimposed, time-locked to the signal instructing the start of saccades, i.e., presentation of a target (VGS) or offset of the central fixation spot (MGS, shown by arrows and vertical bars). Lower traces in each figure depict the velocity profile of the saccades. The horizontal axis gives the time, and the vertical axis gives the eye position (upper trace) or velocity (lower traces). Ticks below are marked at 100-ms intervals.
Figure 4.
Figure 4.
A. Main neural structures for controlling saccades. B. Schematic diagram depicting the involvement of the basal ganglia and cerebellum in saccade generation. DLPFC: dorsolateral prefrontal cortex, FEF: frontal eye field, NRTP: nucleus reticularis tegmenti pontis, PEF: parietal eye field, PPC: posterior parietal cortex, SC: superior colliculus, SEF: supplementary eye field, SNr: substantia nigra pars reticulata, STN: subthalamic nucleus.
Figure 5.
Figure 5.
Neural mechanism for generating memory-guided saccades (MGSs). Hikosaka et al. showed that the initiation of an MGS is mediated by cortical commands projected via the caudate nucleus and substantia nigra pars reticulata (SNr) to the superior colliculus (SC). This pathway corresponds to the direct pathway of the basal ganglia (BG). It contains two inhibitory neurons, i.e., from the caudate to the SNr, and then from the SNr to the SC, hence the name double inhibition pathway. A phasic inhibition of the high-frequency firing of the SNr by the caudate nucleus disinhibits the downstream SC, allowing a saccade to occur. Reproduced with permission from Hikosaka et al. (2000).58)
Figure 6.
Figure 6.
An example of impaired inhibitory control of gaze. A. Prosaccades in the antisaccade (AS) task. Traces are aligned to the time of target presentation. In this task, the subjects are asked to make a saccade in the direction opposite from the target, but in some trials, subjects make inadvertent saccades, termed prosaccades, towards the target as shown in this figure. After making prosaccades, subjects usually make corrective saccades in the instructed direction, i.e., opposite from the target. B. Saccades to cue in the memory guided saccade (MGS) task. Although this subject was asked to keep fixating the central fixation point when a peripheral cue appeared for a brief period (time of appearance is shown by the vertical bar), inadvertent saccades (saccades to cue) were made in some trials. C. Saccades to target in the reaction time task. In this task, the subjects are asked to release the button as soon as the peripheral visual spot comes on (time of appearance is shown by the vertical bar), while keeping the central fixation point fixated. This subject made inadvertent saccades (termed saccades to target) in some trials.
Figure 7.
Figure 7.
Saccade records in patients with Parkinson’s disease (PD). Saccade records of patients with early (middle traces) and advanced PD (bottom traces) are shown in comparison with those of a normal subject (top traces). Conventions as in Fig. 3. Superimposition of traces for 20–30 trials each. The left half shows a visually guided saccade (VGS), the right half shows memory-guided saccade (MGS). Saccades are characterized by hypometria in both tasks. In addition, MGSs are more affected than VGSs in that the latency is more variable and that failed trials also predominate at an advanced stage. Reproduced with permission from Terao et al.10)
Figure 8.
Figure 8.
Impaired inhibitory control of saccades in Parkinson’s disease (PD). Recording of both saccades to cue (left) and saccades to target (right). The frequencies of saccades to cue and saccades to target are higher in PD patients than in normal subjects (top traces) and increase with disease progression. Reproduced and modified with permission from Terao et al.10)
Figure 9.
Figure 9.
Saccade records in a patient with spinocerebellar degeneration (SCD) with pure cerebellar manifestation. Saccade records of patients with SCD at various stages of progression (2nd to 4th traces) are shown in comparison with those of a normal subject (top traces). Conventions as in Fig. 7. Note the variable amplitude across trials for both visually guided saccades (VGSs) and memory-guided saccades (MGSs). In SCD patients, hypometria is evident in VGSs, whereas hypermetria is also observed in some trials for MGSs.
Figure 10.
Figure 10.
Velocity profile of saccades in patients with spinocerebellar degeneration (SCD) with pure cerebellar manifestation and cerebellar type of multiple system atrophy. Subjects were asked to perform the memory-guided saccade (MGS) task, with the target presented at eccentricities of 5, 10, 20, and 30 degrees (A, B, C, and D, respectively). The velocity profiles of saccades (10–20 trials) are superimposed, aligned at the onset of the saccades (0 ms). The horizontal axis gives the time, and the vertical axis the velocity of saccades. Thus, SCD patients (green curves) show a lower peak and a slightly longer duration, compared with a normal control (NC, red curves) subjects and a patient with cerebellar type of multiple system atrophy (MSA-C, blue curves), especially at an eccentricity of 30 degrees. Peak velocity is also reduced in the MSA-C patient at 20–30 degrees.
Figure 11.
Figure 11.
Comparison of peak velocity and duration of saccades among normal subjects, spinocerebellar degeneration (SCD) patients, and cerebellar type of multiple system atrophy (MSA-C) patients. Peak velocity (A) and duration of saccades (deceleration period, B) are shown for normal control (NC) subjects, SCD patients, and MSA-C patients, for all target eccentricities (left of each figure), and separately at different target eccentricities (right of each figure, 5, 10, 20, and 30 degrees). Error bars denote standard errors. Black bars: NC, gray bars: SCD, white bars: MSA-C. Reproduced and modified with permission from Terao et al.124)
Figure 12.
Figure 12.
Saccade records in patients with progressive supranuclear palsy. A. Traces of visually guided saccades (VGSs) (left) and memory-guided saccades (MGSs) (right) are shown for patients with progressive supranuclear palsy (PSP) at early and advanced stages (middle and bottom traces), along with those of a normal control subjects (top traces). Conventions are as in Fig. 3. Reproduced with permission from Terao et al.83) Saccade amplitudes decrease with even lower velocity as the disease progresses, whereas the changes in latency are comparatively mild. B. Repeated saccade recording at an interval of 1–2 years in two patients with PSP. Note the remarkable reduction in saccade amplitude from the first to the second recording. Reproduced with permission from Terao et al.124)
Figure 12.
Figure 12.
Saccade records in patients with progressive supranuclear palsy. A. Traces of visually guided saccades (VGSs) (left) and memory-guided saccades (MGSs) (right) are shown for patients with progressive supranuclear palsy (PSP) at early and advanced stages (middle and bottom traces), along with those of a normal control subjects (top traces). Conventions are as in Fig. 3. Reproduced with permission from Terao et al.83) Saccade amplitudes decrease with even lower velocity as the disease progresses, whereas the changes in latency are comparatively mild. B. Repeated saccade recording at an interval of 1–2 years in two patients with PSP. Note the remarkable reduction in saccade amplitude from the first to the second recording. Reproduced with permission from Terao et al.124)
Figure 13.
Figure 13.
Latency and amplitude of reflexive saccades in various neurological disorders. The latency (A) and amplitude (B) of saccades in the visually guided saccade (VGS; upper figures), gap saccade (GS; middle figures), and memory-guided saccade (MGS) tasks (bottom figures) are shown for normal controls (left-most bar) and various neurological disorders. Frontal: frontal lesion, Parietal-postIC: lesion in the parietal cortex and/or posterior limb of the internal capsule, Caudate-antIC: lesion in the caudate nucleus and/or anterior limb of the internal capsule, Putamen: putaminal lesion, SCD: spinocerebellar degeneration (pure cerebellar manifestation), MSA-C: multiple system atrophy (cerebellar type), MSA-P: multiple system atrophy (parkinsonian type), PD: Parkinson’s disease, PSP: progressive supranuclear palsy. The transparent blue areas denote the 95% confidence range in the age-matched control subjects. The daggers and asterisks indicate a significant difference from normal controls before and after correction, respectively, for multiple comparisons. Error bars give the standard errors (also in the following figures).
Figure 14.
Figure 14.
Memory-guided saccade (MGS) success rate, frequencies of saccades to cue, saccades to target, and amplitude of MGS in various neurological disorders. MGS success rate (A), frequencies of saccades to cue (B), as well as saccades to target (C) are shown for normal controls and various neurological disorders, following conventions of the previous figure.
Figure 15.
Figure 15.
Saccade performances of oculomotor tasks when deep brain stimulation was turned off (left) and on (right) in a PD patient. Traces for 20–30 trials are superimposed for four oculomotor tasks: visually guided saccade (VGS), gap saccade (GS), memory-guided saccade (MGS), and antisaccade (AS). Vertical bars indicate the time signaling the start of saccades. Note the increased amplitude for all tasks when deep brain stimulation (DBS) is switched on (right) as compared to when it is off (left). Reproduced and modified with permission from Yugeta et al.130)

Similar articles

Cited by

References

    1. Yarbus, A.L. (1967) Eye Movements and Vision (B. Haigh, Trans.). Plenum Press, New York.
    1. Rayner K. (2009) Eye movements and landing positions in reading: a retrospective. Perception 38, 895–899. - PubMed
    1. Gilchrist I.D., Brown V., Findlay J.M. (1997) Saccades without eye movements. Nature 390, 130–131. - PubMed
    1. Willmore B.D., Mazer J.A., Gallant J.L. (2011) Sparse coding in striate and extrastriate visual cortex. J. Neurophysiol. 105, 2907–2919. - PMC - PubMed
    1. Hayhoe M., Ballard D. (2005) Eye movements in natural behavior. Trends Cogn. Sci. 9, 188–194. - PubMed