. 2018 Jan 24;6(1):116-124.e3.
doi: 10.1016/j.cels.2017.11.003. Epub 2017 Dec 6.

Quantitative Missense Variant Effect Prediction Using Large-Scale Mutagenesis Data

Affiliations

Quantitative Missense Variant Effect Prediction Using Large-Scale Mutagenesis Data

Vanessa E Gray et al. Cell Syst. .

Abstract

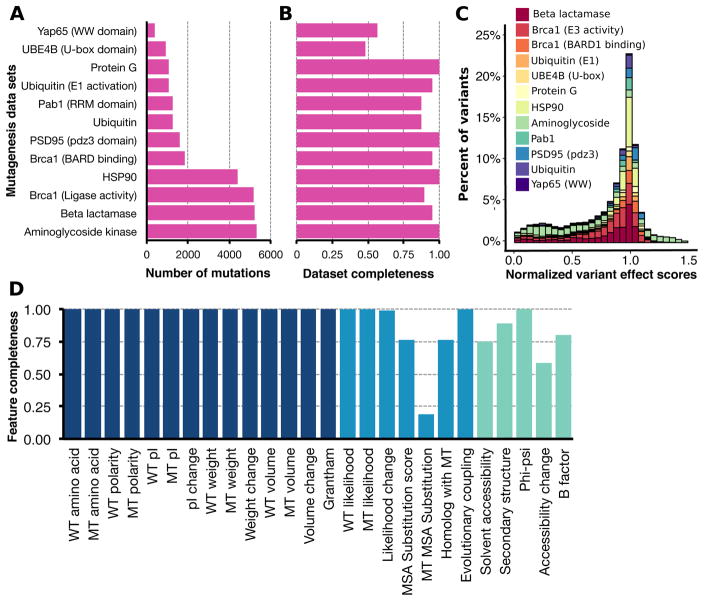
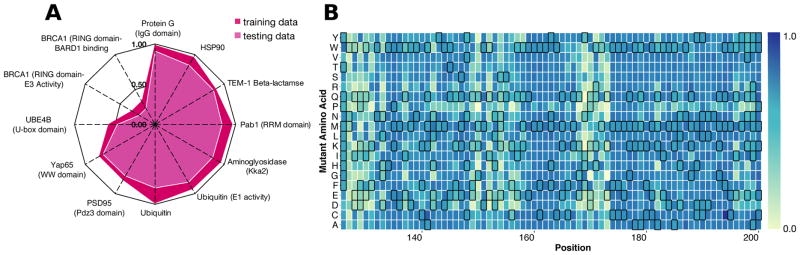
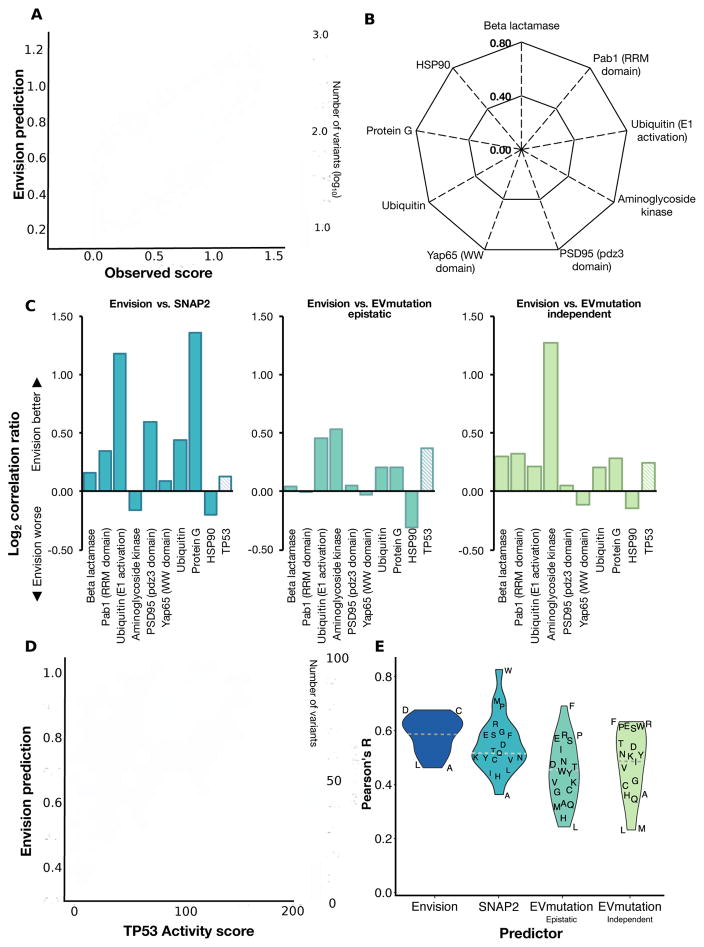
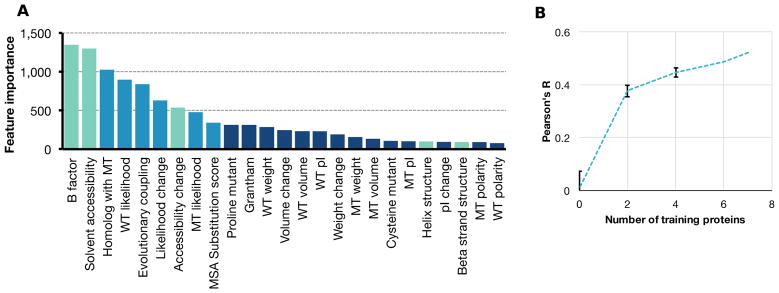
Large datasets describing the quantitative effects of mutations on protein function are becoming increasingly available. Here, we leverage these datasets to develop Envision, which predicts the magnitude of a missense variant's molecular effect. Envision combines 21,026 variant effect measurements from nine large-scale experimental mutagenesis datasets, a hitherto untapped training resource, with a supervised, stochastic gradient boosting learning algorithm. Envision outperforms other missense variant effect predictors both on large-scale mutagenesis data and on an independent test dataset comprising 2,312 TP53 variants whose effects were measured using a low-throughput approach. This dataset was never used for hyperparameter tuning or model training and thus serves as an independent validation set. Envision prediction accuracy is also more consistent across amino acids than other predictors. Finally, we demonstrate that Envision's performance improves as more large-scale mutagenesis data are incorporated. We precompute Envision predictions for every possible single amino acid variant in human, mouse, frog, zebrafish, fruit fly, worm, and yeast proteomes (https://envision.gs.washington.edu/).

Keywords: large-scale mutagenesis; machine learning; variant effect prediction.


Figures

Figure 1
Figure 1. Large-scale mutagenesis data and descriptive features used to train Envision
The number of single mutants (A) collected from different protein or protein domain large-scale mutagenesis datasets and the mutational completeness of each dataset (B) are shown. Mutational completeness was calculated by dividing the number of observed single mutants by the number possible single mutants. (C) The distribution of variant effect scores for each large-scale mutagenesis dataset is shown. For each dataset, variant effect scores were normalized such that a score of one is wild type-like and a score of zero is inactivating (see Supplementary Figure 1 for unnormalized score distribution). Each collected variant was annotated with 27 features, which describe physicochemical (dark blue), evolutionary (blue) or structural (green) variant attributes (Supplementary Table 2). (D) The proportion of variants in the collected large-scale mutagenesis datasets having each feature is shown (WT = wild type, MT = mutant).
Figure 2
Figure 2. Protein-specific gradient boosting models can accurately predict variant effect scores
We trained a model for each protein using a randomly selected 80% of data, with 20% reserved for testing. (A) A radar plot of Pearson’s correlation coefficients between observed and predicted variant effect scores illustrates protein-specific model performance on both training (dark red) and testing data (light red). The PAB1 RRM domain-specific model predicts the effects of variants withheld from training well (Pearson’s R > 0.75), and was used to predict the 197 missing variant effect scores. (B) The completed Pab1 RRM domain sequence-function map is shown for positions 126–200. Each mutagenized position is a column, and each amino acid substitution is a row. Wild type-like variants are colored dark blue and inactive variants are colored light blue. Predicted effects are denoted by black borders.
Figure 3
Figure 3. Envision outperforms other quantitative variant effect predictors
(A) A hexagonal bin plot shows the correlation between predicted and observed variant effect scores for all the large-scale mutagenesis data used to train Envision (Pearson’s R = 0.79). To evaluate performance on data not used in training, models were retrained excluding each one of the nine proteins (see Supplementary Figure 3–4 for cross-validation scheme and training performance). (B) A radar plot shows the correlation (Pearson’s R) between predicted and observed variant effect scores when the indicated protein was left out (see Supplementary Figure 5 for scatter plots). (C) We also compared the leave-one-protein-out models to SNAP2 (left panel), EVmutation-epistatic (middle panel) and EVmutation-independent (right panel). The log2 ratio of each leave-one-protein-out model’s Pearson’s R to another predictor Pearson’s R on the left-out data is shown. Hashed bars indicate relative performance on a set of 2,312 TP53 transactivation activity scores measured in a low-throughput assay and not used in training (see Supplementary Figure 7 for raw comparision). (D) A hexagonal bin plot shows the correlation between Envision predictions and TP53 activity scores (Pearson’s R = 0.58). (E) A violin plot illustrates the distribution of Pearson’s correlation coefficients for variant effect scores and Envision, SNAP2 and EVmutation predictions for different mutant amino acids. The dashed horizontal line indicates the median Pearson’s correlation coefficients for each predictor (see Supplementary Figure 9A–B for heatmap of correlations).
Figure 4
Figure 4. Envision is an interpretable model that will improve with more training data
The number of times each feature is used in Envision’s decision tree ensemble is a measure of feature importance. (A) Feature importance for every physicochemical (dark blue), biological (blue) and structural (green) feature is shown (WT = wild type, MT = mutant). See Supplementary Figure 11–12 for proline feature analysis. (B) To assess the impact of adding more training data to Envision, we conducted a downsampling analysis. Models were trained with increasing numbers of randomly selected protein datasets, and tested on mutations from proteins withheld from training. The mean Pearson’s correlation coefficient between predicted and observed variant effects across testing datasets are shown, organized by the number of proteins included in the training set. Error bars indicate the standard deviation of correlation coeffcients obtained from ten random samplings of proteins to include in the training set. A naïve model (i.e. number of training proteins = 0) was also generated by randomizing feature values for all proteins and repeating the training procedure. The error bars for the naïve model indicate the standard deviation of correlation coefficients obtained from ten different feature randomizations. See Supplementary Figure 13 for left-out feature analysis.

References

    1. Adzhubei IA, Schmidt S, Peshkin L, Ramensky VE, Gerasimova A, Bork P, Kondrashov AS, Sunyaev SR. A method and server for predicting damaging missense mutations. Nat Methods. 2010;7:248–249. doi: 10.1038/nmeth0410-248. - DOI - PMC - PubMed
    1. Amberger JS, Bocchini CA, Schiettecatte F, Scott AF, Hamosh A. OMIM. org: Online Mendelian Inheritance in Man (OMIM®), an online catalog of human genes and genetic disorders. Nucl Acids Res. 2015;43:789–798. doi: 10.1093/nar/gku1205. - DOI - PMC - PubMed
    1. Chen T, Guestrin C. XGBoost: A Scalable Tree Boosting System, the 22nd ACM SIGKDD International Conference; New York, New York, USA: ACM; 2016. - DOI
    1. Deng CX, Brodie SG. Roles of BRCA1 and its interacting proteins. Bioessays. 2000;22:728–737. doi: 10.1002/1521-1878(200008)22:8<728::AID-BIES6>3.0.CO;2-B. - DOI - PubMed
    1. Fowler DM, Fields S. Deep mutational scanning: a new style of protein science. Nat Methods. 2014;11:801–807. doi: 10.1038/nmeth.3027. - DOI - PMC - PubMed