Erosion of State Alcohol Excise Taxes in the United States
- PMID: 29227230
- PMCID: PMC5894857
- DOI: 10.15288/jsad.2018.79.43
Erosion of State Alcohol Excise Taxes in the United States
Abstract
Objective: In the United States, excessive alcohol consumption is responsible for 88,000 deaths annually and cost $249 billion, or $2.05 per drink, in 2010. Specific excise taxes, the predominant form of alcohol taxation in the United States, are based on the volume of alcohol sold rather than a percentage of price and can thus degrade over time because of inflation. The objective of this study was to describe changes in inflation-adjusted state alcohol excise taxes on a beverage-specific basis.
Method: State-level data on specific excise taxes were obtained from the Alcohol Policy Information System and the Tax Foundation. Excise tax rates were converted into the tax per standard U.S. drink (14 g of ethanol) for beer, wine, and distilled spirits, and converted into 2015 dollars using annual Consumer Price Index data.
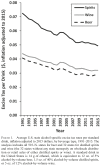
Results: Across U.S. states, the average state alcohol excise tax per drink in 2015 was $0.03 for beer, $0.05 for distilled spirits, and $0.03 for wine. From 1991 to 2015, the average inflation-adjusted (in 2015 dollars) state alcohol excise tax rate declined 30% for beer, 32% for distilled spirits, and 27% for wine. Percentage declines in state excise taxes since their inception were more than twice as large as those from 1991 to 2015.
Conclusions: In 2015, average state specific excise taxes were $0.05 or less per standard drink across all beverage types and have experienced substantial inflation-adjusted declines.
Figures

Comment in
-
An Alcohol Policy Trifecta: Reduce Alcohol Problems, Save on Health Care, Generate Public Revenues.J Stud Alcohol Drugs. 2018 Jan;79(1):5-6. J Stud Alcohol Drugs. 2018. PMID: 29227221 No abstract available.
Comment on
-
Back to the Future . . . or . . . Is That All There Is? A Commentary on Courtney et al. (2018).J Stud Alcohol Drugs. 2018 Jan;79(1):39-40. J Stud Alcohol Drugs. 2018. PMID: 29227228 No abstract available.
References
-
- Alcohol and Tobacco Tax and Trade Bureau. Tax and fee rates. 2016 Retrieved from https://ttb.gov/tax_audit/atftaxes.shtml.
-
- Babor T., Caetano R., Casswell S., Edwards G., Giesbrecht N., Graham K., Rossow I. 2nd ed. Oxford, England: Oxford University Press; 2010. Alcohol: No ordinary commodity: Research and public policy.
-
- Centers for Disease Control and Prevention. Alcohol-Related Disease Impact (ARDI) 2015 Retrieved from https://nccd.cdc.gov/DPH_ARDI/default/default.aspx.
-
- Cook P. Princeton, NJ: Princeton University Press; 2007. Paying the tab: The costs and benefits of alcohol control.
Publication types
MeSH terms
Grants and funding
LinkOut - more resources
Full Text Sources

