. 2018 Jan 2;128(1):463-482.
doi: 10.1172/JCI93924. Epub 2017 Dec 11.

Cografting astrocytes improves cell therapeutic outcomes in a Parkinson's disease model

Affiliations

Cografting astrocytes improves cell therapeutic outcomes in a Parkinson's disease model

Jae-Jin Song et al. J Clin Invest. .

Abstract

Transplantation of neural progenitor cells (NPCs) is a potential therapy for treating neurodegenerative disorders, but this approach has faced many challenges and limited success, primarily because of inhospitable host brain environments that interfere with enriched neuron engraftment and function. Astrocytes play neurotrophic roles in the developing and adult brain, making them potential candidates for helping with modification of hostile brain environments. In this study, we examined whether astrocytic function could be utilized to overcome the current limitations of cell-based therapies in a murine model of Parkinson's disease (PD) that is characterized by dopamine (DA) neuron degeneration in the midbrain. We show here that cografting astrocytes, especially those derived from the midbrain, remarkably enhanced NPC-based cell therapeutic outcomes along with robust DA neuron engraftment in PD rats for at least 6 months after transplantation. We further show that engineering of donor astrocytes with Nurr1 and Foxa2, transcription factors that were recently reported to polarize harmful immunogenic glia into the neuroprotective form, further promoted the neurotrophic actions of grafted astrocytes in the cell therapeutic approach. Collectively, these findings suggest that cografting astrocytes could be a potential strategy for successful cell therapeutic outcomes in neurodegenerative disorders.

Keywords: Neuronal stem cells; Neuroscience; Parkinson’s disease; Transplantation.


Conflict of interest statement

Conflict of interest: The authors have declared that no conflict of interest exists.

Figures

Figure 1
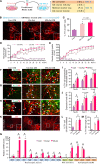
Figure 1. DA neuron differentiation and maturation promoted by coculturing with astrocytes.
(A) Schematic for the coculture experiments. (B) Representative images of TH+ DA neurons differentiated from VM-NPCs in the presence of Ctx-NPCs (control), Ctx-Ast, or VM-Ast. Scale bar: 100 μm. Insets, enlarged images of the boxed areas (original magnification, ×400). (C) DA neuronal yields at differentiation day 6 (D6). (DH) Morphometric measurement of DA neuron maturity assessed by neurite outgrowth lengths (D), soma size (E), and by the Sholl test (F and G). In the Sholl analysis, the total number of neurite crossings was counted in each circle with the radius increasing in steps of 15 μm (F). The critical value (G) is the radius at which there was a maximum number of neurite crossings. *P < 0.05, significantly different from the control; #P < 0.05, significantly different from Ctx-Ast, 1-way ANOVA. n = 3–5 wells (C) and 100 (D and E) and 25–30 (F and G) TH+ cells in each group.(H) Representative TH+ neuronal morphologies reconstructed in 3D by Neurolucida. (IL) Synaptic densities on TH+ fibers. (I) Representative confocal images of synapsin+TH+ fibers. Scale bar: 25 μm. Puncta positive for the synaptic vesicle–specific markers SV2 (J), synapsin (K), and bassoon (L) on TH+ fibers were counted. *P < 0.05, significantly different from the control; #P < 0.05, significantly different from Ctx-Ast. n = 20 TH+ fibers for each group. (M) Presynaptic DA release. n = 3 independent cultures. DA levels were measured in the media conditioned in the differentiated cultures for 24 hours (D13–D15) and in cultures evoked by KCl-mediated depolarization for 30 minutes. *P < 0.05; #P < 0.05, 1-way ANOVA.
Figure 2
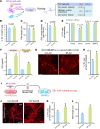
Figure 2. DA neurons differentiated with astrocytes are more resistant to toxic insult along with increased midbrain-specific factor expressions.
(AC) Expression of midbrain-specific markers in the differentiated DA neurons. Expression levels of the midbrain-specific markers in C were determined in individual TH+ DA neurons by measuring MFI using LAS image analysis (Leica). *P < 0.01; #P < 0.01, 1-way ANOVA. n = 9 microscopic fields (B) and n = 32–36 TH+ cells (C). Scale bar: 50 μm. (DF) Resistance of DA neurons against a toxic stimulus. TH+ DA neurons differentiated in the presence of Ctx- or VM-Ast (Ctx-NPCs as the control) at D12 were exposed to H2O2 (1,000 μM) for 10 hours and viable TH+ cell counts (E) and fiber lengths (F) were measured on the following day. Representative TH+ cell images after H2O2 treatment are shown in D. Scale bar: 100 μm. Insets, enlarged images of the boxed areas (original magnification, ×400). Data in E represent percentage of TH+ cells that survived after the toxin exposure compared with those that were not exposed to toxin (H2O2 = 0 μM). *P < 0.01; #P < 0.01, 1-way ANOVA. n = 3 independent experiments (2–3 culture wells/experiment) (E) and n = 80–90 TH+ cells (F).
Figure 3
Figure 3. Paracrine manner of the astrocyte-mediated neurotrophic actions.
(A) Schematic of the CM treatment experiments. Media conditioned in Ctx- or VM-Ast (or Ctx-NPC as control) was collected and added to cultured VM-NPCs during the differentiation period. (B) Representative images for TH+ DA neurons at D12. Scale bar: 100 μm. Insets, enlarged images of the boxed areas (original magnification, ×400). (C) TH+DA neuronal yields at D6. *P < 0.05, significantly different from control. n = 3 cultures for each group. (D and E) Morphometric measurement of neurite outgrowth assessed by a time-lapse imaging system. VM-NPCs at D3 were treated with the CMs. Neurite lengths (D) and branch points of the neurites (E) in 27 randomly selected microscopic fields from 3 independent cultures were automatically analyzed for 42 hours using IncuCyte’s NeuroTrack software. (FJ) Expression of mature neuronal (NeuN) and mDA neuronal (Foxa2, Nurr1) markers in the differentiated DA neurons. I and J depict percentage of TH+ cells expressing the markers and the expression levels (MFI) in individual TH+ DA neurons, respectively. *P < 0.01, significantly different from control; #P < 0.01, significantly different from Ctx-Ast, 1-way ANOVA. n = 9 microscopic fields (I) and n = 32–36 TH+ cells (J). (KM) Resistance of DA neurons against a toxic stimulus. TH+ DA neurons differentiated in the presence of Ctx- or VM-Ast-CM (Ctx-NPC-CM as the control) at D12 were exposed to H2O2 (1,000 μM) for 8 hours and viable TH+ cells were counted on the following day (L). Shown in K are representative TH+ cell images after H2O2 treatment. Scale bars: 100 μm. Insets, high-powered images of the boxed areas (original magnification, ×400). Fiber lengths of surviving TH+ cells were also estimated (M). *P < 0.01; #P < 0.01, 1-way ANOVA. n = 3 independent experiments (2–3 wells/experiment) (L) and n = 80–90 TH+ cells (M). (N) Expression of neurotrophic genes in the cultured Ctx-Ast, VM-Ast, and Ctx-NPCs, estimated by real-time PCR (qPCR) analyses. *P < 0.01; #P < 0.05, 1-way ANOVA. n = 3.
Figure 4
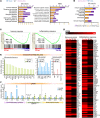
Figure 4. Potential molecules mediating the dopaminotrophic functions of astrocytes.
(AE) mRNA-seq analyses for the DEGs among VM-Ast, Ctx-Ast, and control Ctx-NPCs. Genes upregulated and/or downregulated by over 2-fold were selected for analysis. (A) Venn diagram summarizing the overlap between DEGs from VM-Ast versus Ctx-NPCs (left circle) and Ctx-Ast versus Ctx-NPCs (right circle). The numbers of genes are indicated in the Venn diagram. To calculate overlap with DEGs, statistical analysis was performed using the χ2 test based on a 2 × 2 table using R version 3.3.2 of the MASS package. (B) GO and KEGG analyses for the 4,445 overlapping genes (common astrocytic genes). Purple bars indicate the number of genes under the designated GO term/KEGG pathway. Yellow bars indicate P values, and negative logs of the P values (bottom) are plotted on the x axis. (C and D) Volcano plot (C) and GO/KEGG analyses (D) for the DEGs between VM-Ast and Ctx-Ast. (E) Heatmap showing fold changes of the selected genes in VM- and Ctx-Ast compared with control Ctx-NPCs (log2 folds, VM-Ast/Ctx-NPC and Ctx-Ast/Ctx-NPC). (F) Expression of important pro- and antiinflammatory and secretory antioxidant genes was further confirmed by qPCR analyses. *P < 0.05, significantly different from control; #P < 0.05, significantly different from Ctx-Ast, 1-way ANOVA. n = 3 PCR reactions.
Figure 5
Figure 5. Forced expression of Nurr1+Foxa2 in VM-Ast potentiates astrocyte-mediated dopaminotrophic actions.
(A) Schematic of procedure of the coculture experiments. VM-Ast were transduced with Nurr1+Foxa2-expressing lentiviruses (or control mock viruses), harvested, and mixed with VM-NPCs. After differentiation was induced in the VM-NPCs mixed with the astrocytes, TH+ DA neuronal yields (B), morphologic (C) and synaptic maturation (D), expression of midbrain-specific markers (E), presynaptic DA release (F), and resistance to a toxic stimulus (G and H) were assessed in the TH+ DA neurons in the differentiated cultures. (IL) CM treatment experiments. CM was prepared from Nurr1+Foxa2-transduced VM-Ast (or mock-transduced VM-Ast as control) and added to VM-NPCs during the differentiation period. The differentiated cultures at D12 were exposed to H2O2 (1,000 μM, 10 hours), and the number (K) and neurite length (L) of surviving TH+ cells were estimated as described in the Figure 3 legend. *P < 0.05; #P < 0.05, 2-tailed Student’s t test. n = 3 culture wells (F, H, K) and 80–90 TH+ cells (L). Scale bars: 100 μm.
Figure 6
Figure 6. RNA-seq analysis for the DEGs between Nurr1+Foxa2- and control VM-Ast.
(A) GO and KEGG analyses for the genes upregulated (log2 > 1) or downregulated (log2 < –1) in Nurr1+Foxa2-VM-Ast (NF-Ast) compared with control VM-Ast (Cont-Ast) (FPKM > 1). (B) Gene ontologies only for the genes downregulated in NF-Ast vs. control-Ast (log2 < –1, FPKM>1). (C) GSEA for immune response and inflammatory response gene sets enriched in Nurr1+Foxa2-VM-Ast versus VM-Ast. (D) Heatmap of the expression levels (FPKMs) of all the genes annotated to the ontologies related to immune (121 genes)/inflammatory response (103 genes) in control-Ast vs. NF-Ast in B. Expressions of selected immune/inflammatory, inhibitory ECMs, and antioxidant genes are further shown in E. (F) mRNA levels of important pro- and antiinflammatory and neurotrophic factors were further confirmed by real-time qPCR analyses. *P < 0.05, 2-tailed Student’s t test. n = 3.
Figure 7
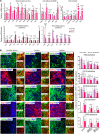
Figure 7. Improvement of host brain environments by grafting cultured astrocytes.
Rats were transplanted with VM-Ast, Ctx-Ast, or Ctx-NPCs (control). (A) qPCR data for gene expressions associated with neurotrophic or hostile brain environments among the grafted groups. The PCR analyses were carried out in the graft-host interfaces dissected as described in Methods at 1 month after transplantation. *P < 0.05; #P < 0.05. n = 3. (B) Immunohistochemical analyses for the glial cells immunoreactive for proinflammatory/cytotoxic (iNOS, CD11b, CD16) and antiinflammatory/neuroprotective (Arginase, CD206) factors. The immunoreactive cells along the graft-host interfaces were counted in 6 cryosectioned slices from 3 animals/each group at 7–10 days after transplantation. Data are expressed as percentage of immunoreactive cells out of DAPI+ cells, of GFAP+ astrocytic, and of Iba1+ microglial populations. *P < 0.05; #P < 0.05, 1-way ANOVA. n = 6. Scale bar: 100 μm.
Figure 8
Figure 8. Effects of Nurr1+Foxa2 priming in donor VM-Ast to improve host brain environments after transplantation.
Neurotrophic or inflammatory factor expressions in the brains grafted were determined by qPCR (A) and immunohistochemical (B) analyses as described in Figure 7. *P < 0.05; #P < 0.05, 2-tailed t test. n = 3 PCRs (A) and 6 slices (B). Scale bar: 100 μm.
Figure 9
Figure 9. Cografting of astrocytes improves the therapeutic effects of VM-NPC transplantation in a PD rat model.
NPCs derived from rat embryonic VM at E12 were expanded in vitro, harvested, and mixed with Ctx-NPCs (control), Ctx-Ast, VM-Ast, or N+F-VM-Ast before cell injection. The mixed cells were intrastriatally transplanted into 6-OHDA–lesioned PD model rats. Behavioral (AC) and histological (DL) analyses were carried out every month for the 6 months after transplantation (A) or at 6 months after transplantation (BL). (A) Amphetamine-induced rotation scores were determined every month for the 6 months after transplantation. Data are given as percentage changes in rotation scores for each animal compared with the pretransplantation value. Mean + SEM of the rotation scores is depicted. n = 6 for each group. Significant decreases in rotation scores were seen in animals that received astrocyte cografts compared with those that received control NPCs alone. *P < 0.05; #P < 0.05, Ctx-Ast; P < 0.05, VM-Ast at each posttransplantation time point, 1-way ANOVA. Behaviors of the transplanted animals were further assessed by step adjustment (B) and cylinder (C) tests at 6 months after transplantation. Statistical significances (P < 0.01) among groups are expressed using schematics in the graphs. One-way ANOVA followed by Bonferroni’s post hoc analysis. (DL) Histologic analyses 6 months after transplantation. (D) Overview of the TH+ cell grafts. (E) Graft volume. (F) Total number of TH+ cells. (G) TH+ cell density in the graft. *P < 0.05; #P < 0.05, 1-way ANOVA. (HJ) Morphologic maturation of DA neurons in the grafts estimated by TH+ fiber length. Shown are immunohistochemical (H) and Neurolucida reconstruction of representative TH+ neuronal images (I). (K and L) Synaptic maturation of TH+ DA neurons estimated by synapsin+ puncta density. *P < 0.05; #P < 0.05, 1-way ANOVA. Scale bars, 100 μm (D); 50 μm (H); 25 μm (K).
Figure 10
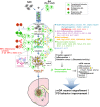
Figure 10. Schematic summary for the trophic actions of astrocytes cografted in PD cell therapeutic approach.
Astrocytes (VM, N+F-VM-Ast) cografted with VM-NPCs promote a series of transplanted NPC survival, mDA neuron differentiation, neuronal maturation, and synaptic integration by correcting hostile host brain environments. The astrocytic actions are attained via secretion of various neurotrophic ECM proteins, antioxidants, neurotrophic cytokines, GLAST/GLT1-mediated clearance of glutamate toxicity, etc. Ultimately, PD behaviors are improved along with enriched engraftment of mature and functional mDA neurons expressing midbrain-specific markers.

Comment in

References

    1. Goldman SA. Stem and progenitor cell-based therapy of the central nervous system: hopes, hype, and wishful thinking. Cell Stem Cell. 2016;18(2):174–188. doi: 10.1016/j.stem.2016.01.012. - DOI - PMC - PubMed
    1. Steinbeck JA, Studer L. Moving stem cells to the clinic: potential and limitations for brain repair. Neuron. 2015;86(1):187–206. doi: 10.1016/j.neuron.2015.03.002. - DOI - PMC - PubMed
    1. Widner H, Brundin P. Immunological aspects of grafting in the mammalian central nervous system. A review and speculative synthesis. Brain Res. 1988;472(3):287–324. - PMC - PubMed
    1. Barker RA, Widner H. Immune problems in central nervous system cell therapy. NeuroRx. 2004;1(4):472–481. doi: 10.1602/neurorx.1.4.472. - DOI - PMC - PubMed
    1. Ideguchi M, Shinoyama M, Gomi M, Hayashi H, Hashimoto N, Takahashi J. Immune or inflammatory response by the host brain suppresses neuronal differentiation of transplanted ES cell-derived neural precursor cells. J Neurosci Res. 2008;86(9):1936–1943. doi: 10.1002/jnr.21652. - DOI - PubMed

Publication types

MeSH terms

Substances