. 2018 Jan 2;128(1):427-445.
doi: 10.1172/JCI93801. Epub 2017 Dec 11.

Drug-perturbation-based stratification of blood cancer

Affiliations

Drug-perturbation-based stratification of blood cancer

Sascha Dietrich et al. J Clin Invest. .

Abstract

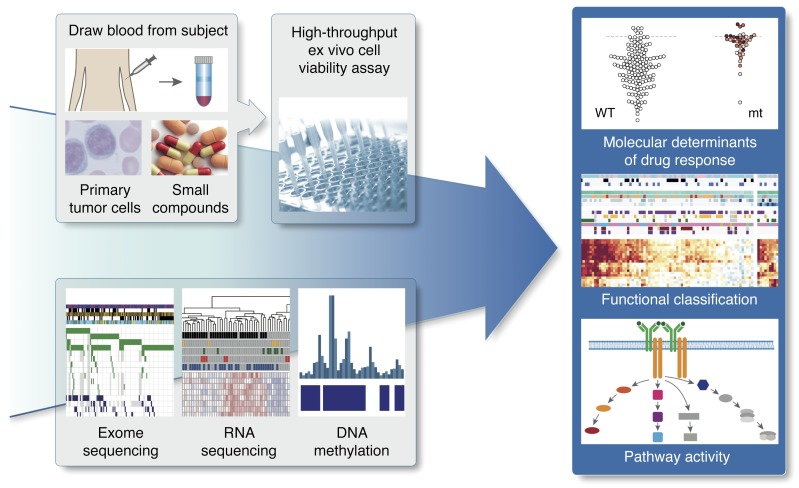
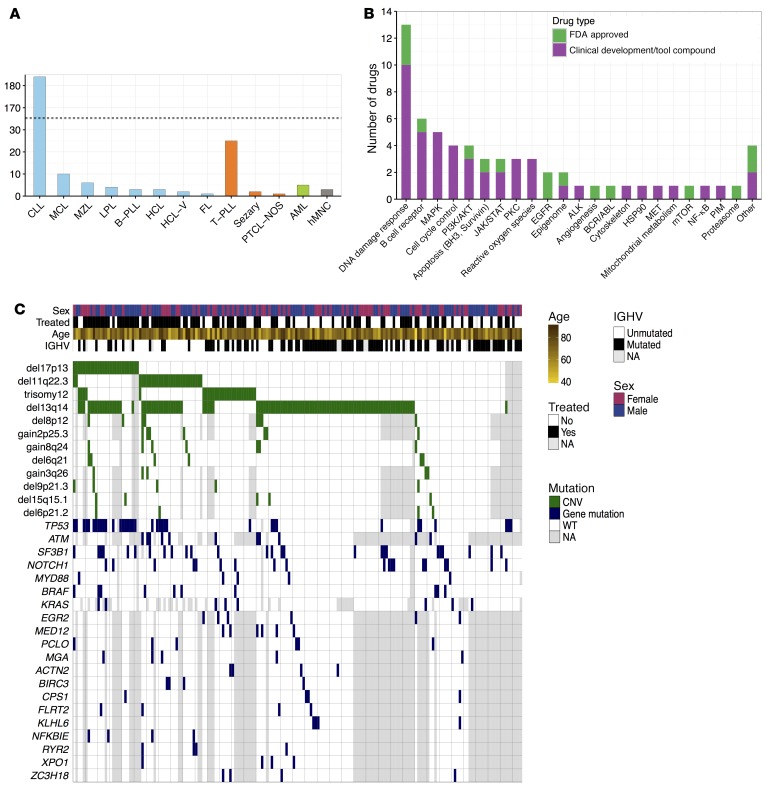
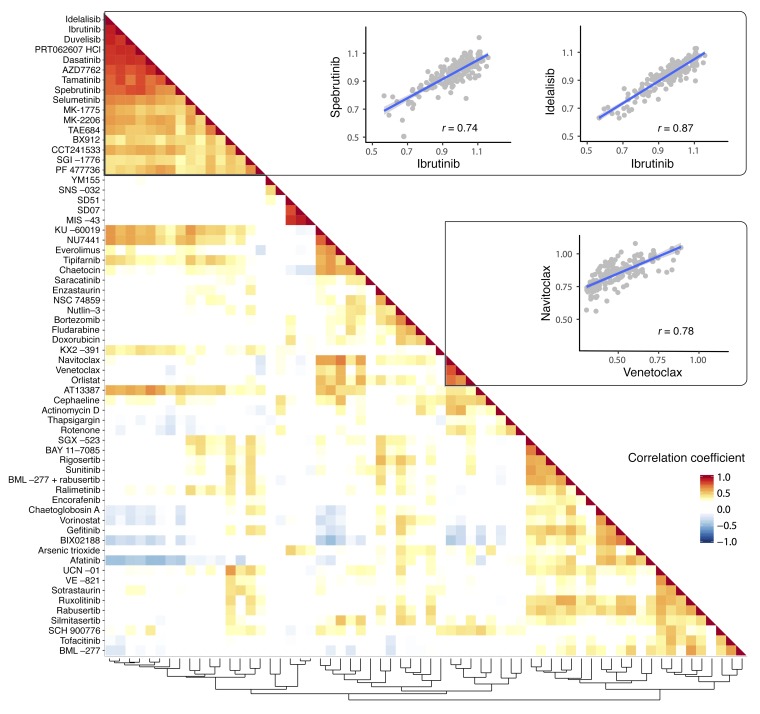
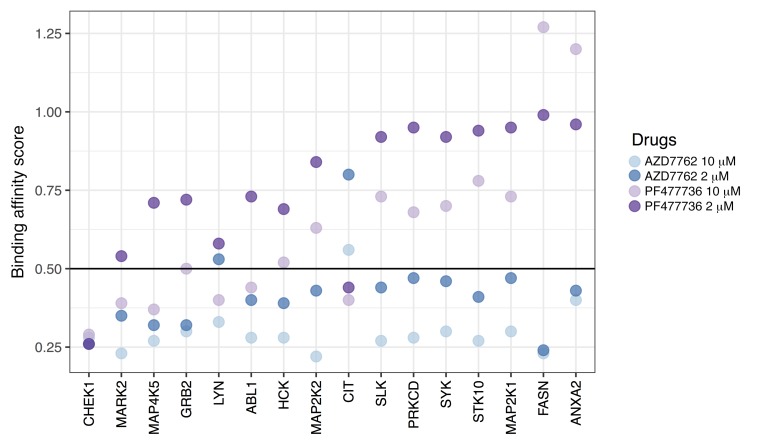
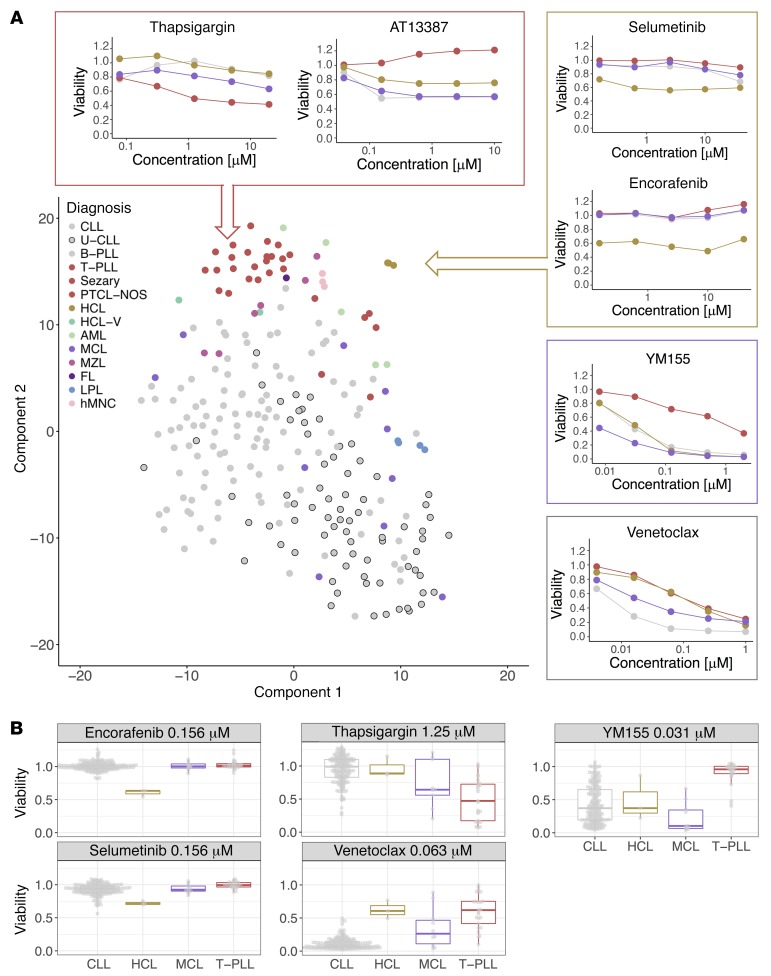
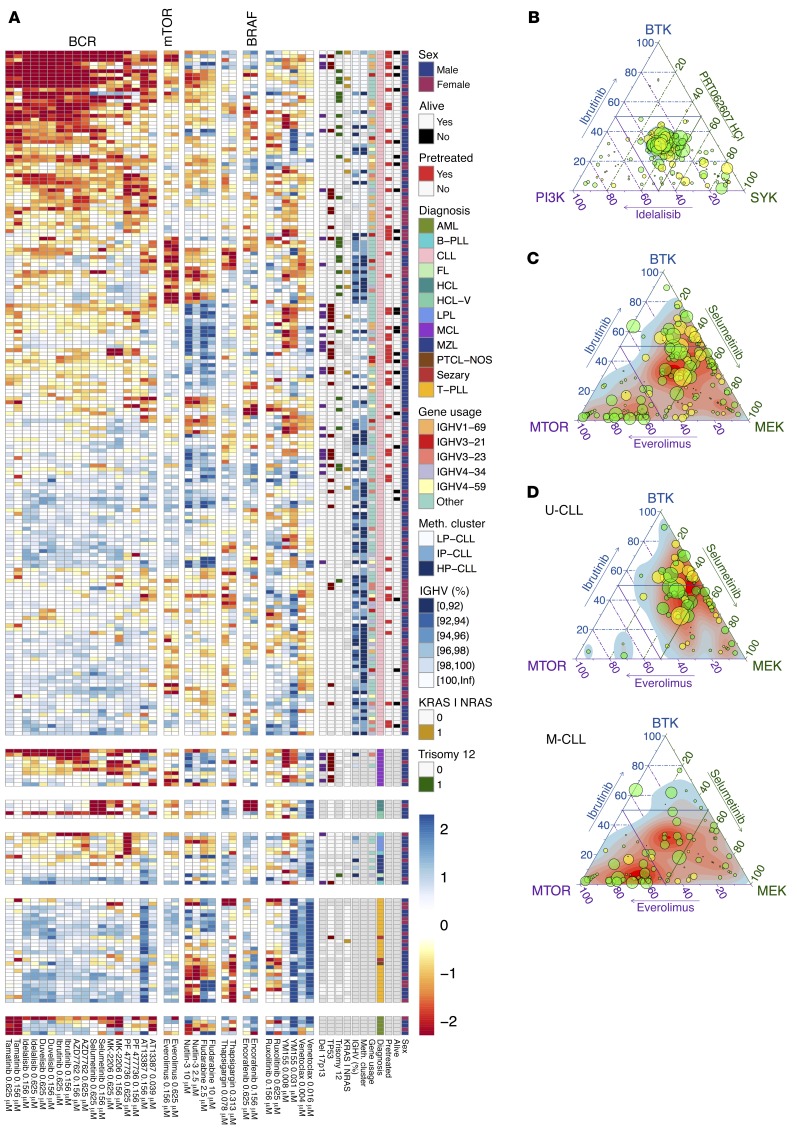
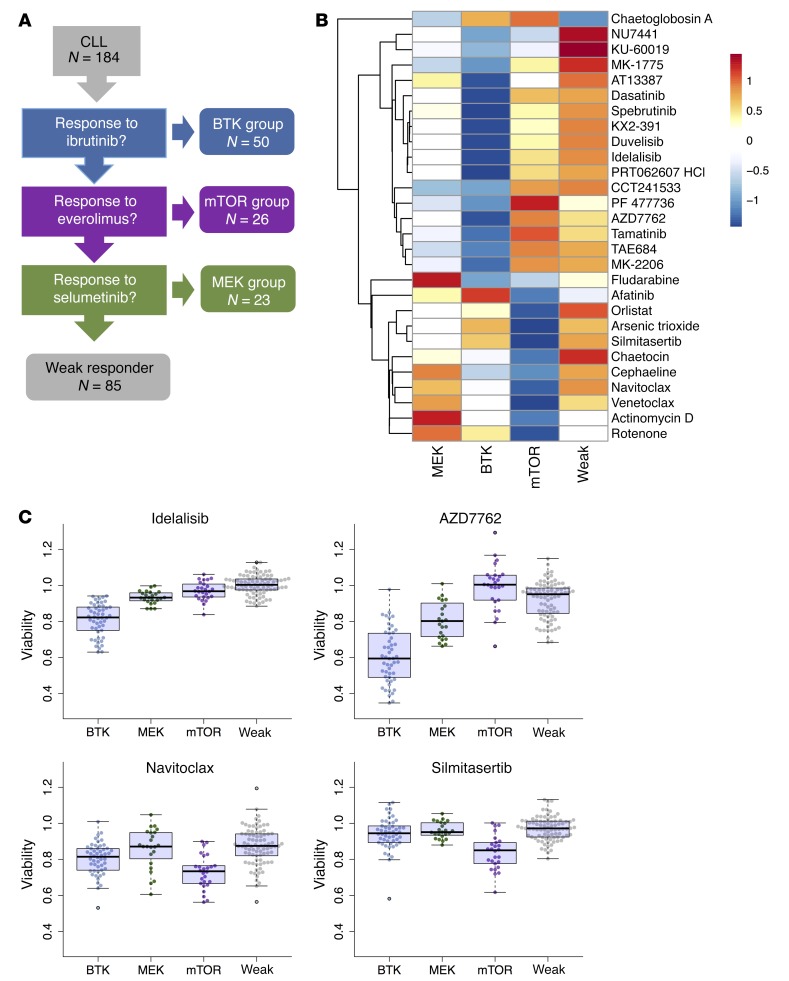
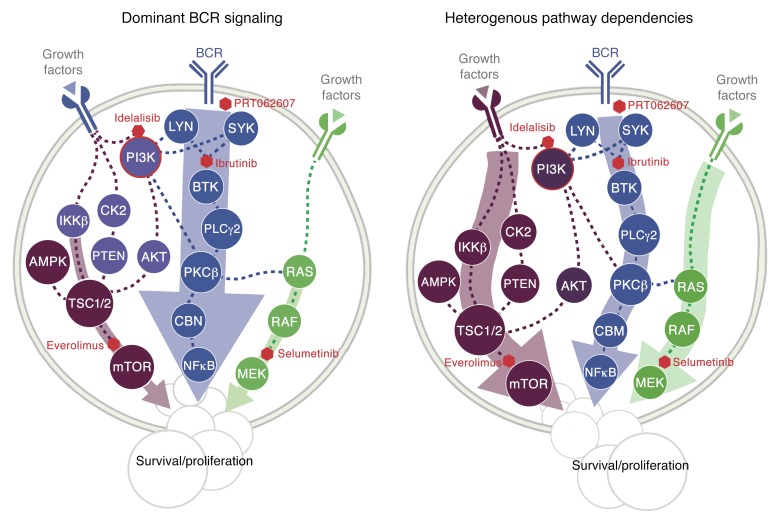
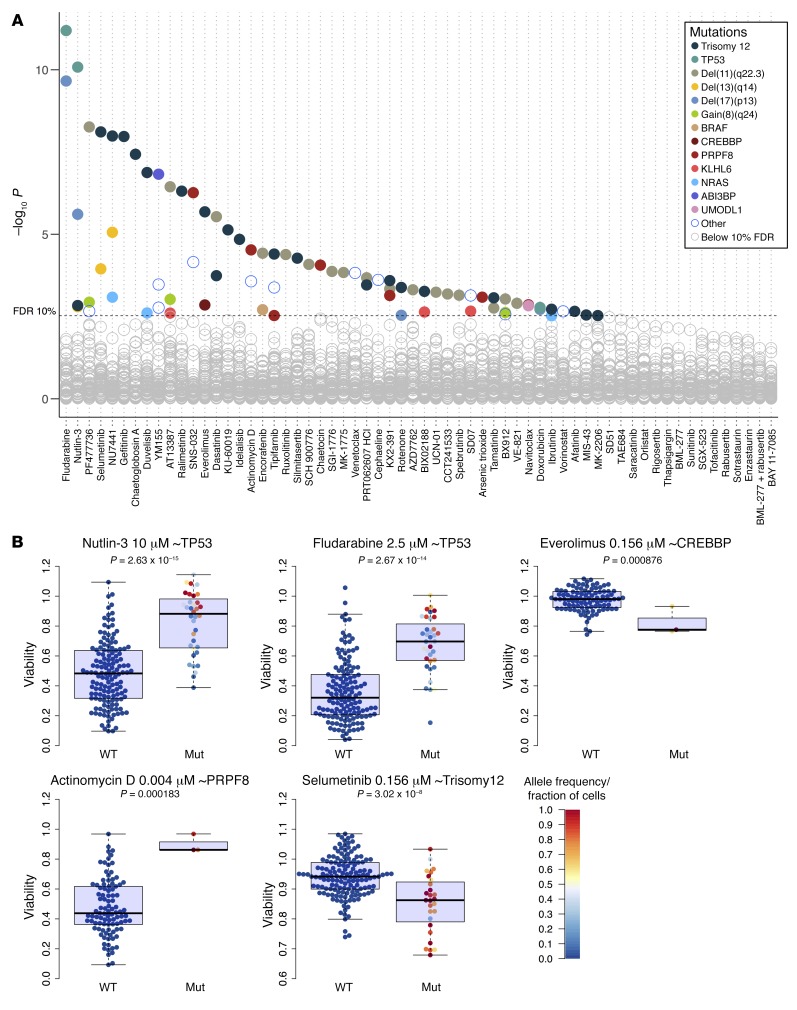
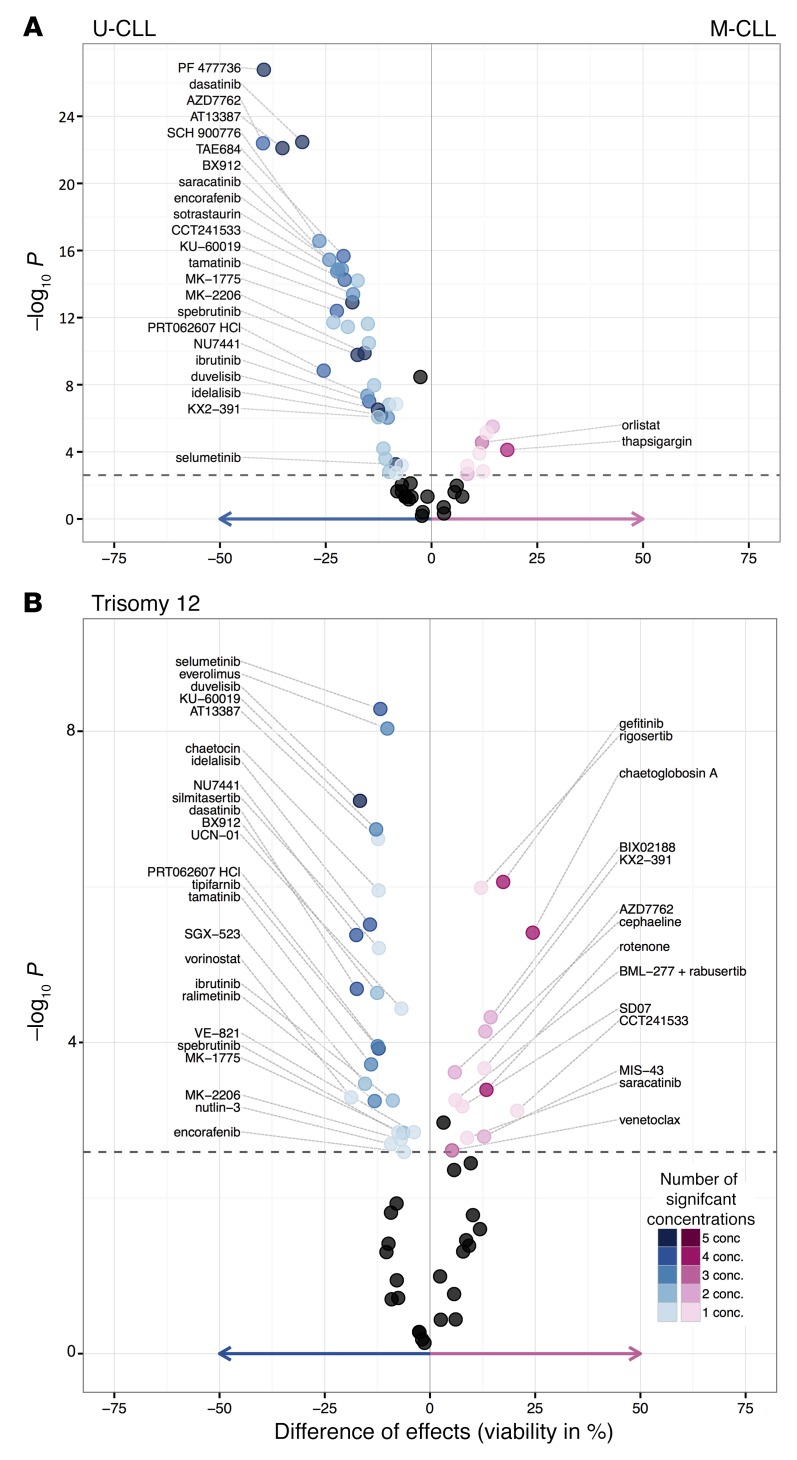
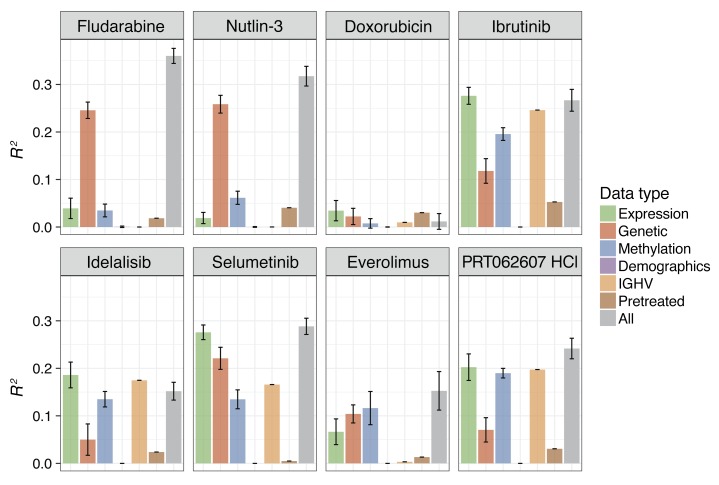
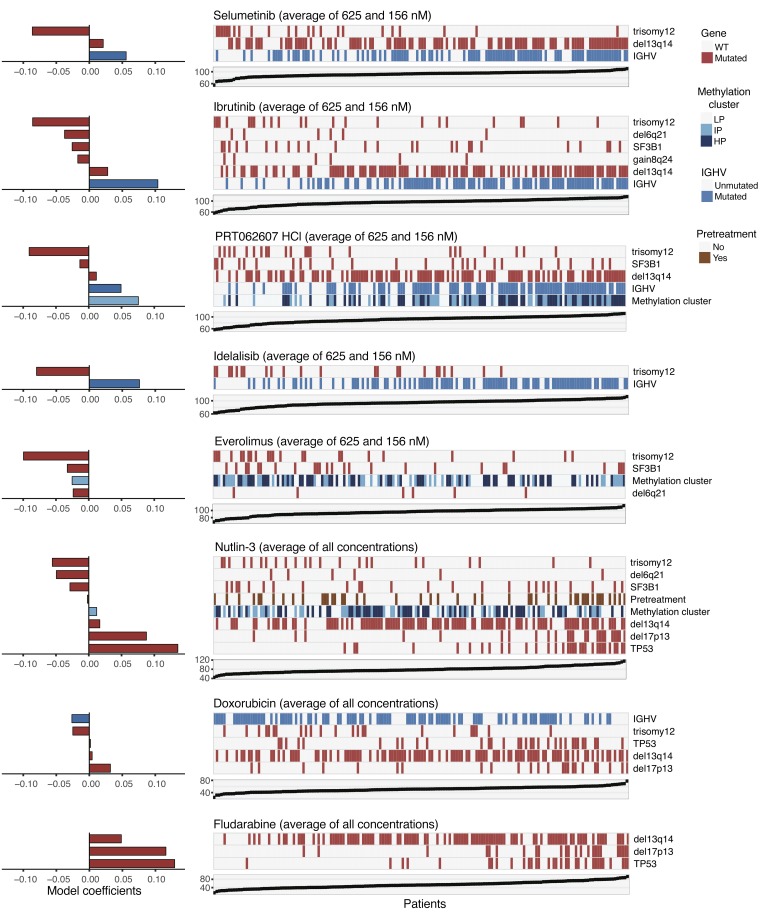
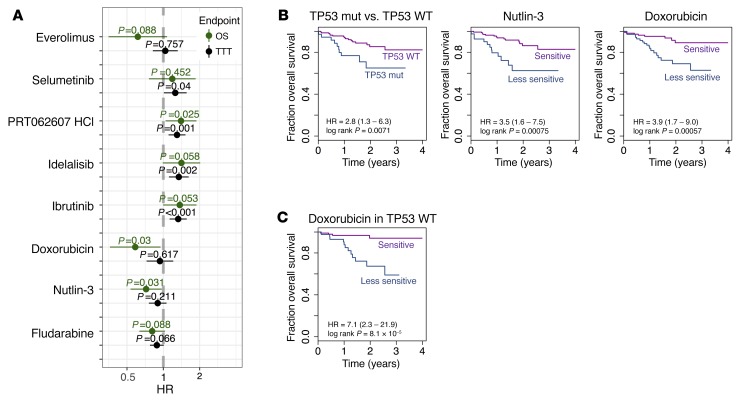
As new generations of targeted therapies emerge and tumor genome sequencing discovers increasingly comprehensive mutation repertoires, the functional relationships of mutations to tumor phenotypes remain largely unknown. Here, we measured ex vivo sensitivity of 246 blood cancers to 63 drugs alongside genome, transcriptome, and DNA methylome analysis to understand determinants of drug response. We assembled a primary blood cancer cell encyclopedia data set that revealed disease-specific sensitivities for each cancer. Within chronic lymphocytic leukemia (CLL), responses to 62% of drugs were associated with 2 or more mutations, and linked the B cell receptor (BCR) pathway to trisomy 12, an important driver of CLL. Based on drug responses, the disease could be organized into phenotypic subgroups characterized by exploitable dependencies on BCR, mTOR, or MEK signaling and associated with mutations, gene expression, and DNA methylation. Fourteen percent of CLLs were driven by mTOR signaling in a non-BCR-dependent manner. Multivariate modeling revealed immunoglobulin heavy chain variable gene (IGHV) mutation status and trisomy 12 as the most important modulators of response to kinase inhibitors in CLL. Ex vivo drug responses were associated with outcome. This study overcomes the perception that most mutations do not influence drug response of cancer, and points to an updated approach to understanding tumor biology, with implications for biomarker discovery and cancer care.

Keywords: B cell receptor; Drug screens; Hematology; Leukemias; Oncology.


Conflict of interest statement

Conflict of interest: The authors have declared that no conflict of interest exists.

Figures

Figure 1
Figure 1. Study outline.
By combining functional drug response screening with omics profiling, we systematically queried drug response phenotypes, underlying molecular predictors, and pathway dependencies of leukemia and lymphoma. mt, mutant.
Figure 2
Figure 2. Overview of sample cohort and drugs.
(A) Pathology classification of samples. The largest groups were chronic lymphocytic leukemia (CLL; n = 184), T cell prolymphocytic leukemia (T-PLL; n = 25), and mantle cell lymphoma (MCL; n = 10). Color indicates cell lineage: B cell (blue), T cell (orange), myeloid (green), and normal blood cells (gray). The dashed line indicates a scale break. (B) Compounds tallied by their targets. Green indicates FDA-approved drugs and purple indicates drugs that are tool compounds or in clinical development. (C) The genetic landscape of our CLL cohort (n = 184), including recurrent copy number variations (CNVs, green) and somatic mutations (blue); instances of missing data are shown in gray. Previously reported associations include the frequent co-occurrence of del17p13 and TP53 mutation (Fisher test: P = 10–11, odds ratio = 29), del11q22 and ATM mutation (Fisher test: P = 0.05, odds ratio = 3.7). In addition, we detected a mutual exclusivity pattern between del13q14 and trisomy 12 (Fisher test: P = 0.0006, odds ratio = 0.2). ALK, anaplastic lymphoma kinase; FL, follicular lymphoma; HCL-V, hairy cell leukemia variant; hMNC, human mononuclear cell; LPL, lymphoplasmacytic lymphoma; NA, not available; PTCL-NOS, peripheral T cell lymphoma not otherwise specified.
Figure 3
Figure 3. Drug profile similarities reflect mode of action.
“Guilt by association” prediction of drug targets and mechanism of action. For each pair of drugs used in the screen, the Pearson correlation coefficient (r) was computed from the viabilities of the 184 CLL samples after drug treatment (average of the 2 lowest concentrations). The rows and columns of the resulting drug-drug correlation matrix were arranged based on the hierarchical clustering shown at the bottom, and the matrix is displayed as a heatmap. The major blocks are (i) kinase inhibitors targeting the B cell receptor, including idelalisib (PI3K), ibrutinib (BTK), duvelisib (PI3K), PRT062607 (SYK); (ii) inhibitors of redox signaling/reactive oxygen species (ROS) (MIS−43, SD07, SD51); and (iii) BH3 mimetics (navitoclax, venetoclax). The scatter plots show 3 instances of pairwise correlation analyses of drugs.
Figure 4
Figure 4. Target profiling of AZD7762 and PF477736.
Binding affinity scores were determined proteome-wide using the kinobead assay (26); lower scores indicate stronger physical binding. Here, the data are shown for those proteins that had a score less than 0.5 in at least one assay, and that were previously identified as responders to B cell receptor stimulation with anti-IgM in B cell lines (27).
Figure 5
Figure 5. Disease-specific drug response phenotypes of blood cancers.
(A) t-distributed stochastic neighbor embedding (t-SNE), a machine learning algorithm for dimensionality reduction, was used to visualize similarities among 246 patient samples with respect to the 315 drug sensitivity measurements (each of 63 drugs at 5 concentrations). The plot shows a distinctive separation of pathologic disease entities based on their drug sensitivity pattern. The line plots show mean viabilities for individual disease entities (CLL, gray; HCL, yellow; MCL, purple; and T-PLL, brown) and drugs across 5 concentrations, highlighting disease-specific differences. (B) Primary data for individual drugs provide examples for disease-specific response and sample variation (CLL, n = 184; HCL, n = 3; MCL, n = 10; T-PLL, n = 25). FL, follicular lymphoma; HCL-V, hairy cell leukemia variant; hMNC, human mononuclear cell; LPL, lymphoplasmacytic lymphoma PTCL-NOS, peripheral T cell lymphoma not otherwise specified.
Figure 6
Figure 6. Functional classification of blood cancer based on drug perturbations.
(A) A global overview of the drug response landscape reveals heterogeneity within diseases and functionally defined disease subgroups. The heatmap matrix shows the viability measurements for 246 samples (rows) and 17 of the drugs at 2 concentrations each (columns). The data are shown on a Z-score scale, i.e., centered and scaled within each column. The color bars to the right show sample annotations. Prior to clustering, samples were divided into 6 disease groups, indicated by the horizontal gaps. A more detailed version of this plot is available in Supplemental Figure 8. (B) Relative effects of ibrutinib (BTK), idelalisib (PI3K), and PRT062607 (SYK) on each of the 184 CLL samples are shown in ternary plots. Given percentage viability values (vi) of 3 drugs compared, the relative effect of drug i is measured by (100 – vi)/(300 – [v1 + v2 + v3]), for i = 1, 2, and 3. Numbers per sample add up to 1 and correspond to positions within an equilateral triangle. The maximum of 100 – vi, as a measure of the overall susceptibility of the sample, is shown by dot size. Each drug is represented by the average of the 2 lowest concentrations. Response to the BCR inhibitors was similar in the majority of CLL samples. Prior treatment is indicated by dot color (green: pretreated, n = 52; yellow: untreated, n = 132). (C) In contrast, comparison of relative responses to ibrutinib, selumetinib, and everolimus revealed a heterogeneous response. (D) Same data as in panel C, but separately plotted for U- and M-CLL (n = 74 and n = 98, respectively). U-CLL showed predominant reliance on BTK and MEK signaling, whereas M-CLL showed a less BTK-dependent response pattern, with many cases of predominant MEK or mTOR sensitivity. FL, follicular lymphoma; HCL-V, hairy cell leukemia variant; hMNC, human mononuclear cell; LPL, lymphoplasmacytic lymphoma PTCL-NOS, peripheral T cell lymphoma not otherwise specified.
Figure 7
Figure 7. Hierarchical model of drug response phenotypes in CLL.
(A) We derived a decision tree model that classifies CLL patients into 4 drug-response-based groups. First, we asked if ibrutinib caused strong viability effects (BTK group n = 50/184), second, whether the remaining patient samples responded to everolimus (mTOR group n = 26/184) and third, whether they responded to selumetinib (n = 23/184). The remaining patients were classified as weak responders (n = 85/184) (Supplemental Figure 10). (B) Summary of cosensitivities for the 4 groups. We compared drug responses of each group to all samples from the remaining groups (average of the 2 lowest concentrations) using Student’s t test. Significant differences (FDR = 5%) with a mean effect size greater than 5% are shown. The heatmap visualizes mean viabilities, row-centered and scaled to zero mean and unit standard deviation. (C) Exemplary plots of individual sample data for 4 of the drugs shown in panel B. The BH3 mimetic navitoclax and the CK2 inhibitor silmitasertib had stronger viability effects in the mTOR group. AZD7762 and idelalisib had stronger viability effects in the BTK group.
Figure 8
Figure 8. A model for the roles of BCR, mTOR, and MEK pathway activities in CLL.
BCR-dependent cases are highly sensitive to inhibition of SYK, BTK, and PI3K. MEK and mTOR activation occur downstream of BCR. Most U-CLL patients belong to this group. In contrast, there is a group of CLL where cells receive survival signals from alternative sources (e.g., cytokines/chemokines) and whose drug response pattern is inconsistent with canonical BCR signaling, as the effect of inhibiting mTOR is greater than for BTK. PI3K, phosphatidylinositol 3-kinase; IKKβ, IκBα-Kinase-complexes; AMPK, AMP-activated protein kinase; TSC1/2, hamartin/tuberin; PDK1, pyruvate dehydrogenase kinase 1; SGK3, serine/threonine-protein kinase; PLC, phosphoinositide-phospholipase C; PKCβ, protein kinase C β; CBM, CARMA1-Bcl10-MALT1 complex; mTOR, mechanistic target of rapamycin; SYK,spleen tyrosine kinase; BTK, Bruton’s tyrosine kinase; Lyn, tyrosine kinase Lyn.
Figure 9
Figure 9. Genomics of drug sensitivity in CLL.
(A) Drug responses are modulated by many of the mutations recurrent in CLL. The y axis shows the negative logarithm of the t-test P values of all tested associations. Viabilities across different drug concentrations were aggregated using Tukey’s median polish method. Each circle represents a drug-gene association. Tests with P values smaller than the threshold corresponding to a false discovery rate (FDR) of 10% (method of Benjamini and Hochberg) are indicated by colored circles, where the colors represent the gene mutations and structural aberrations. To control for potential confounding effects of prior treatment history of the donating patients, we also performed this analysis with pretreatment status as a blocking factor in the association tests; the results of this analysis are provided in Supplemental Figure 19 and are concordant with those shown here (Supplemental Figure 20). (B) Primary data of selected drug-gene associations. The fraction of cells for trisomy 12 and the allele frequency (AF) for the mutations TP53, PRPF8, and CREBBP is shown by the color code.
Figure 10
Figure 10. Impact of IGHV and trisomy 12 status on drug sensitivity in CLL.
(A) Drug responses are modulated by IGHV status. The units on the x axis of the volcano plot are the difference in percentage viability; negative values indicate higher sensitivity in U-CLL than in M-CLL. For each drug, the 5 concentration steps were tested separately. Drugs with 3 or more significant associations are labeled, and the largest viability effect and corresponding P value are shown. Significant differences were evident for core BCR pathway inhibitors (duvelisib, idelalisib, spebrutinib), nominal CHEK inhibitors (PF477736, AZD7762, SCH 900776), AT13387, and dasatinib. The dashed line indicates an FDR of 10% (P < 0.0026). (B) Similar to panel A, for trisomy 12. Negative values indicate higher sensitivity in cases with trisomy 12.
Figure 11
Figure 11. Explanatory power of data types for drug response prediction.
Explanatory power (R2) of the features from the different data types for prediction of drug response. For fludarabine, doxorubicin, and nutlin-3, we fit multivariate regression models to predict the average viability value across all 5 concentrations. For the targeted drugs ibrutinib (BTK), idelalisib (PI3K), selumetinib (MEK), everolimus (mTOR), and PRT062607 (SYK), we used the average of the 2 lowest concentrations, 156 and 625 nM, as the dependent variable. As predictors, we used the different data types as indicated by the colors: demographics (age, sex), mutations, IGHV status, pretreatment (coded as 0/1), and the top 20 principal components of the gene expression or DNA methylation data matrices. In addition to using each data type separately, we also fit models with all data types combined (gray). L1 (lasso) regularization was used, with the parameter lambda chosen by cross-validation, and shown are mean and standard deviation across 100 repetitions. Drug responses to nutlin-3 and fludarabine were predominantly explained by gene mutations and copy number variants (genetics). In contrast, response to kinase inhibitors was best explained by IGHV status, gene expression, or methylation patterns.
Figure 12
Figure 12. Multivariate regression models for drug response.
Visualization of fitted adaptive L1 (lasso) regularization multivariate models using gene mutations, IGHV status, pretreatment, and methylation clusters (coded as 0/0.5/1) as predictors (gene expression and DNA methylation principal components were set aside due to redundancy). Each matrix shows the predictor values corresponding to the model for a drug, and the response values are shown in the scatter plot below. The fitted model coefficients are shown by horizontal bars. Negative coefficients (e.g., trisomy 12) indicate lower viability after drug treatment (i.e., greater sensitivity) if the feature is present. The red and blue boxes indicate the non-zero regression coefficients and their signs LP, low programmed; IP, intermediate programmed; HP, high programmed.
Figure 13
Figure 13. Ex vivo drug response and outcome.
(A) Association of drug responses with time from sampling to treatment (TTT; n = 174) and overall survival (OS; n = 184), assessed by univariate Cox regressions. Shown are estimated hazard ratios (HR) and 95% confidence intervals. The average viability values, across all 5 concentrations for fludarabine, doxorubicin, and nutlin-3, and across the 2 lowest concentrations 156 and 625 nM for the targeted drugs ibrutinib (BTK), idelalisib (PI3K), selumetinib (MEK), everolimus (mTOR), and PRT062607 (SYK), were scaled such that a unit change of the regressor corresponds to 10% change in cell viability. (B) Kaplan-Meier plots for OS stratified by TP53 mutation status, and nutlin-3 and doxorubicin response. Patient groups of nutlin-3 or doxorubicin responders and weak responders were defined by ex vivo drug responses dichotomized using maximally selected rank statistics to visualize effects. The same 172 CLL patient samples were used for all 3 Kaplan-Meier plots. Thirty-six patient samples were TP53 mutated, and 39 and 40 patient samples were in the nutlin-3 or doxorubicin weak-responder groups, respectively. (C) Analogous to the rightmost plot in panel B, but limited to patients with wild-type TP53.

References

    1. de Gramont A, et al. Pragmatic issues in biomarker evaluation for targeted therapies in cancer. Nat Rev Clin Oncol. 2015;12(4):197–212. - PubMed
    1. Sawyers CL. The cancer biomarker problem. Nature. 2008;452(7187):548–552. doi: 10.1038/nature06913. - DOI - PubMed
    1. Garnett MJ, et al. Systematic identification of genomic markers of drug sensitivity in cancer cells. Nature. 2012;483(7391):570–575. doi: 10.1038/nature11005. - DOI - PMC - PubMed
    1. Barretina J, et al. The Cancer Cell Line Encyclopedia enables predictive modelling of anticancer drug sensitivity. Nature. 2012;483(7391):603–607. doi: 10.1038/nature11003. - DOI - PMC - PubMed
    1. Basu A, et al. An interactive resource to identify cancer genetic and lineage dependencies targeted by small molecules. Cell. 2013;154(5):1151–1161. doi: 10.1016/j.cell.2013.08.003. - DOI - PMC - PubMed

Publication types

MeSH terms

Supplementary concepts