. 2018 Jan;36(1):70-80.
doi: 10.1038/nbt.4038. Epub 2017 Dec 11.

Integrative single-cell analysis of transcriptional and epigenetic states in the human adult brain

Affiliations

Integrative single-cell analysis of transcriptional and epigenetic states in the human adult brain

Blue B Lake et al. Nat Biotechnol. 2018 Jan.

Abstract

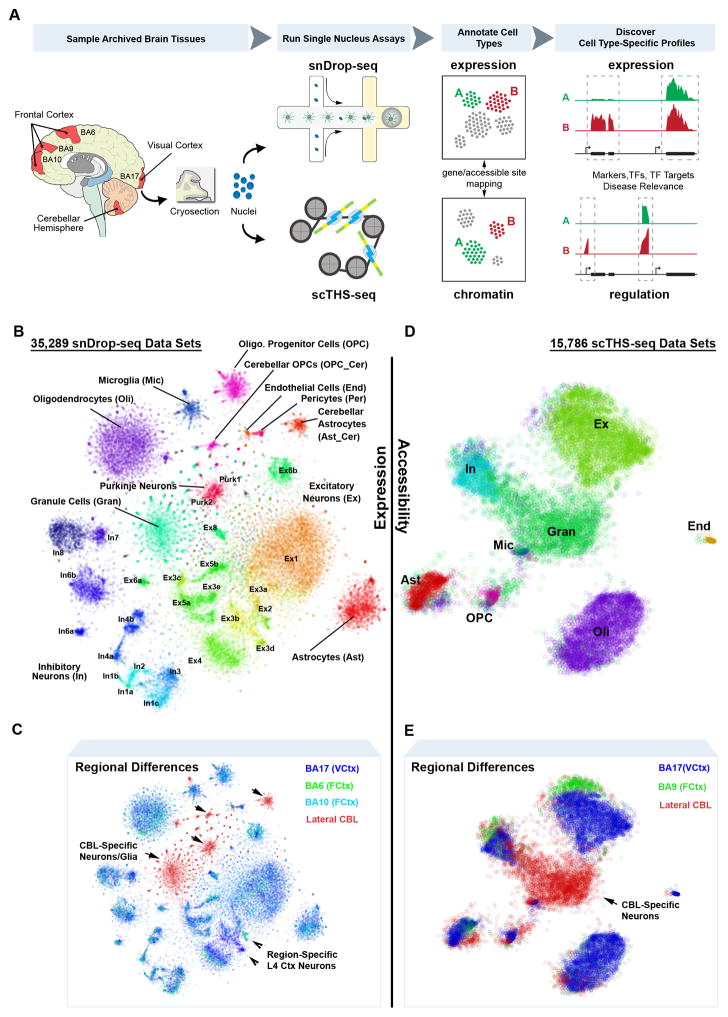
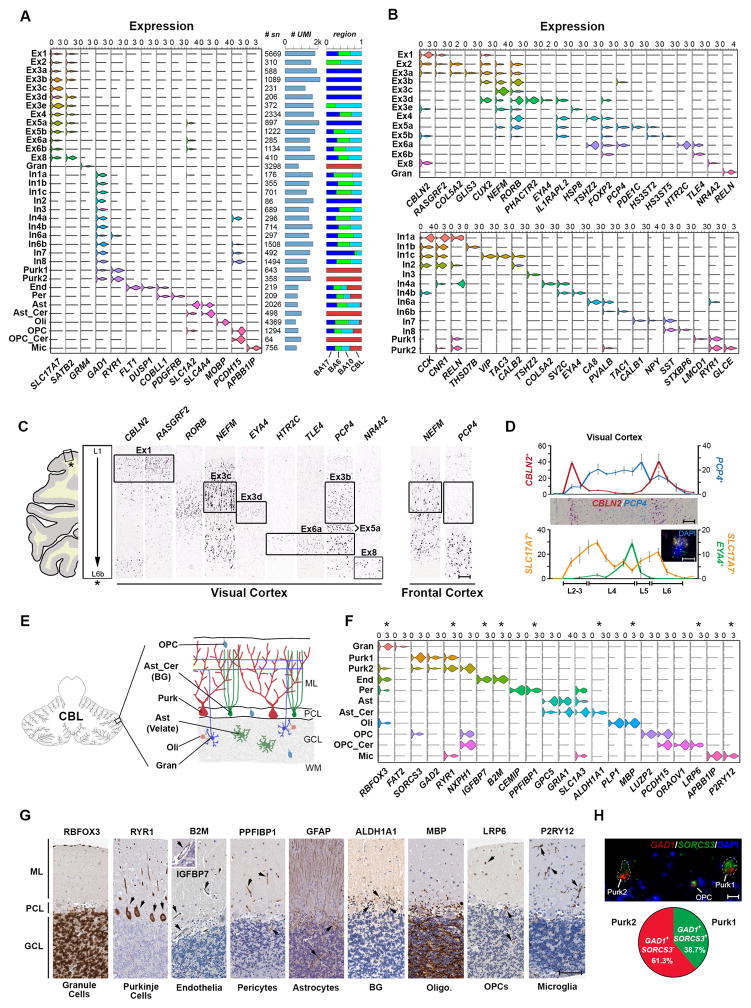
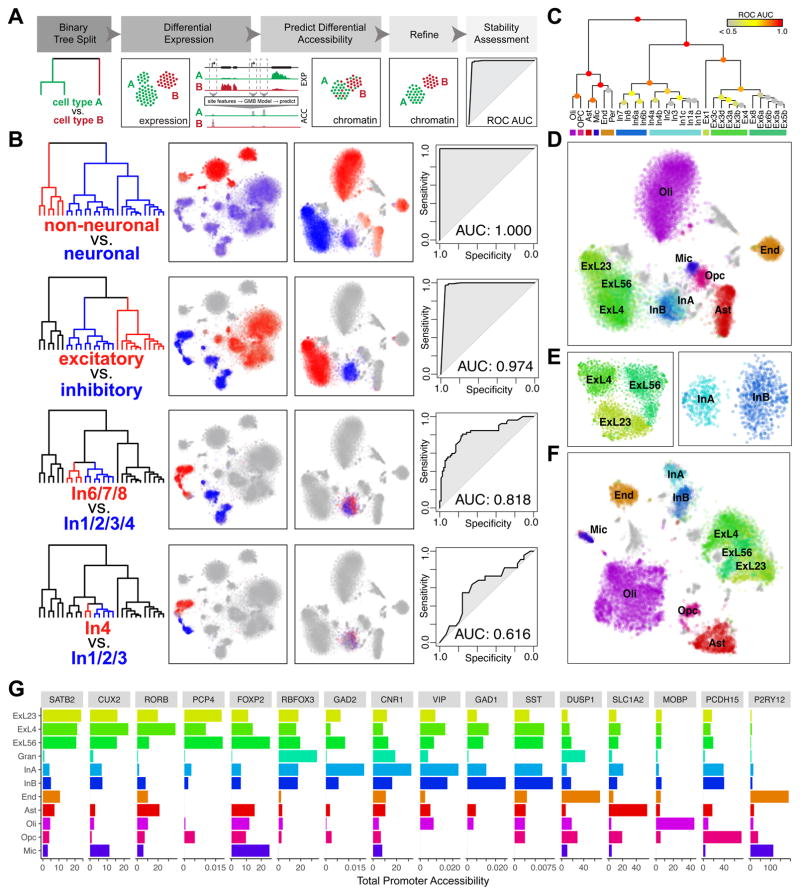
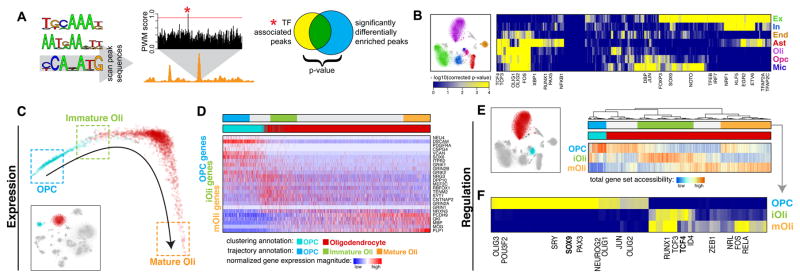
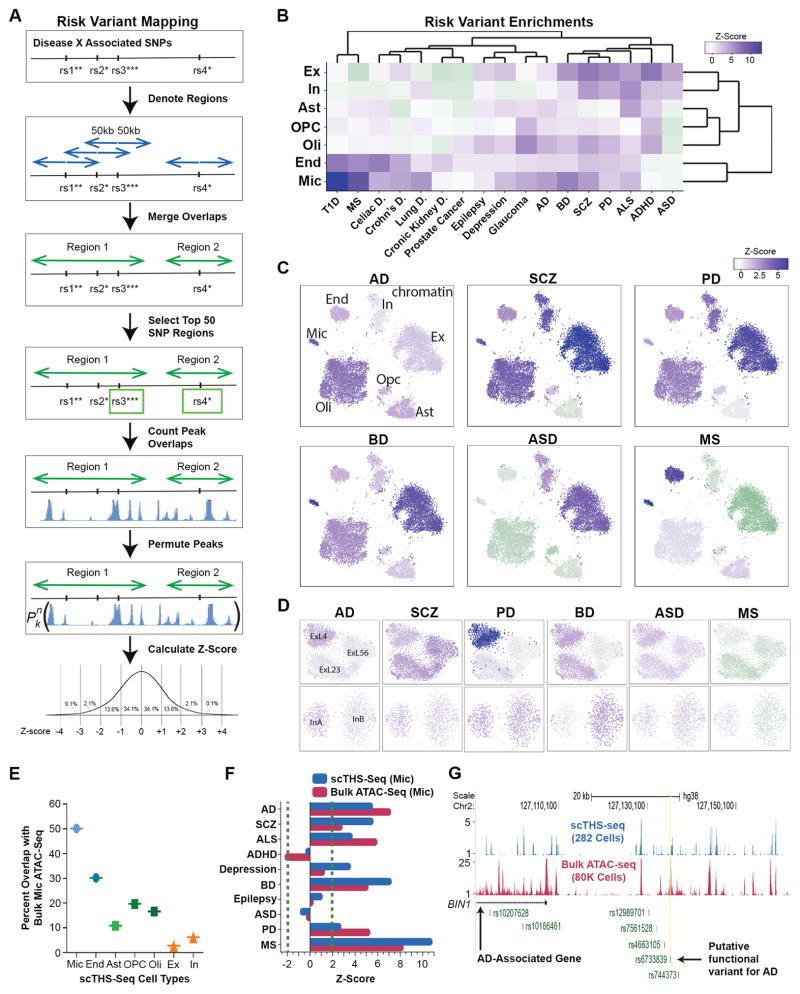
Detailed characterization of the cell types in the human brain requires scalable experimental approaches to examine multiple aspects of the molecular state of individual cells, as well as computational integration of the data to produce unified cell-state annotations. Here we report improved high-throughput methods for single-nucleus droplet-based sequencing (snDrop-seq) and single-cell transposome hypersensitive site sequencing (scTHS-seq). We used each method to acquire nuclear transcriptomic and DNA accessibility maps for >60,000 single cells from human adult visual cortex, frontal cortex, and cerebellum. Integration of these data revealed regulatory elements and transcription factors that underlie cell-type distinctions, providing a basis for the study of complex processes in the brain, such as genetic programs that coordinate adult remyelination. We also mapped disease-associated risk variants to specific cellular populations, which provided insights into normal and pathogenic cellular processes in the human brain. This integrative multi-omics approach permits more detailed single-cell interrogation of complex organs and tissues.


Conflict of interest statement

Competing Financial interests

The authors declare no competing financial interest.

Figures

Fig. 1
Fig. 1
Integrative single-cell analyses resolve intra- and inter-regional cellular diversity in the adult human brain. A. Overview of single-nucleus isolation from the visual cortex (BA17), frontal cortex (BA6, BA9, BA10) and cerebellum (CBL) for snDrop-seq, scTHS-seq and downstream expression/regulation analyses. B. Combined expression (snDrop-seq) data showing distinct cell type and subtype clustering visualized using t-distributed Stochastic Neighbor Embedding (t-SNE). C. Regional origination of data sets shown in (B). D. Combined chromatin accessibility (scTHS-seq) data showing major cell type clusters visualized (Table S2) using t-SNE. E. Regional origination of data sets shown in (D).
Fig. 2
Fig. 2
Expression data permits identification and classification of molecularly and spatially distinct cell types and subtypes. A. Violin plots of expression values for type-specific marker genes. Number of data sets, average transcript (UMI) counts and relative proportion across regions sampled (Fig. 1C) are indicated for each cluster. B. Top panel: violin plots showing gene expression values of layer specific, and subtype-enriched markers for excitatory neuronal subtypes. Bottom panel: violin plots showing expression values for classical interneuron marker genes and subtype-enriched transcripts. C. RNA in situ hybridization (ISH) stains (Allen Human Brain Atlas, Table S9) of the visual cortex for select marker genes shown in (B). Frontal cortex stains demonstrate absence of associated layer 4 subpopulations. Scale = 200 μm. D. Top panel: RNA ISH counts showing number of positive cells for CBLN2 and PCP4 (chromogenic image shown) in image fields spanning the pial layer to the white matter. Scale = 200 μm. Lower panel: RNA ISH counts for SLC17A7 single positive cells and SLC17A7 and EYA4 double positive cells (as shown in inset). Error bars represent standard deviation for four separate layer cross-sections (replicate regions). Scale = 10 μm. E. Schematic of the cerebellar cytoarchitecture. ML = molecular layer, PCL = purkinje cell layer, GCL = granule cell layer, WM = white matter. F. Violin plots of expression values for type-specific marker genes specifically for cerebellar data. Asterisks indicate markers shown in (G). G. Protein staining (Human Protein Atlas, Table S10) for select cell-type specific markers shown in (F). Scale = 100 μm. H. Fluorescent RNA ISH image (adjusted for visualization, see Methods) showing representative GAD1 positive Purk1 (SORCS3+) and Purk2 (SORCS3 or low) neurons. OPCs showing low expression of GAD1 were also SORCS3+. Scale = 20 μm. Pie chart shows proportions of GAD1+/SORCS3+ and GAD1+/SORCS3 populations quantified from imaged Purk neurons (Fig. S9D).
Fig. 3
Fig. 3
Integrative mapping of transcriptional and epigenetic subtypes. A. Overview. First, a taxonomy of cell types is constructed based on the expression data. For each binary split in the transcriptional taxonomy, a set of genes differentially expressed between the two branches is identified. A GBM model is used to predict a set of differentially accessible chromatin sites corresponding to the identified differential expression signature, to classify scTHS-seq cells as belonging to either branch. Predicted branch annotations are refined by identifying differentially accessible sites using scTHS-seq data. Stability of the branch annotations is assessed using cross-validation (see Methods). B. Identification of In neuron subpopulations using the integrative approach. In the top binary split of transcriptional taxonomy, neuronal cells are separated from non-neuronal cells. Differentially expressed genes (Z > 1.96) are identified. Average expression of genes significantly upregulated in each branch is shown, with red corresponding to high expression in the red branch and blue corresponding to high expression in the blue branch. Predicted differentially accessible sites are visualized in the same way. Prediction performance, as assessed by ROC curves and AUC, demonstrates high stability of split for non-neuronal vs. neuronal, Ex vs. In, and In1,2,3,4 vs. In6,7,8 but not In4 vs. In1,2,3. C. Summary of stability for each binary split of transcriptional taxonomy. D. Final cell type predictions from the integrated analysis projected onto the original visual cortex scTHS-seq data t-SNE embedding. E. Refinement of the visual cortex scTHS-seq data t-SNE embedding for Ex (left) and In (right) subpopulations only, integrating predicted differentially accessible sites. F. Refinement of the complete visual cortex scTHS-seq data t-SNE integrating predicted differentially accessible sites. G. Accessibility of select marker genes. Read mapping to promoters of each gene for all cells within each epigenetic subpopulation from (F) are averaged for number of sites and cells for comparison across subpopulations.
Fig. 4
Fig. 4
Mapping transcription factor (TF) activities to specific cell types to resolve remyelination programs. A. Schematic of TF analysis. Briefly, putative TF binding sites (TFBS) were identified within all hypersensitive sites based on matching position weight matrices (PWMs). To identify relevant factors for a given cell type, sites showing differential accessibility within that cell type were tested for statistical enrichment of different TFBS. B. Heatmap of TF association to epigenetic subpopulations (right). Each column is a TF. Each row is an epigenetic subpopulation from the visual cortex (left). Select TFs are annotated. C. Diffusion map pseudotime trajectory for OPCs and Oli snDrop-Seq datasets from the visual cortex (shown as inset). Datasets are colored by the original dataset annotations from clustering analysis. Refined annotations based on the inferred pseudotime trajectory are shown as boxes. D. Heatmap of select genes involved in remyelination program. Columns are datasets ordered by the pseudotime trajectory in (C). Rows are genes ordered by association with OPCs, iOli, and mOli based on significance of differential upregulation in each group. E. Accessibility of genes involved in remyelination programs for OPCs and Oli scTHS-Seq datasets from the visual cortex (left). Heatmap of total promoter accessibility (right). Each column is a cell. Each row represents accessibility for genes differentially upregulated in OPCs, iOli, and mOli respectively. F. Heatmap of TF association to stages of Oli maturation. Each column is a TF. Each row is an epigenetic subpopulation inferred from (E). Select TFs are annotated.
Fig. 5
Fig. 5
Mapping of common disease risk variants to specific brain cell types. A. Method overview. Briefly, GWAS SNPs were obtained for each disease, extended to 100KB, merged, the top 50 most significant SNPs selected, number of peaks in overlaps counted, peaks permuted and the number of peaks counted in each region for each permutation, and then lastly Z-scores were calculated. B. Heat map representing the enrichment Z-scores across 7 cell clusters (rows) for 10 brain diseases (columns) and 7 unrelated diseases (Table S8). T1D = Type 1 Diabetes, MS = Multiple Sclerosis, AD = Alzheimer’s Disease, BD = Bipolar Disorder, SCZ = Schizophrenia, PD = Parkinson’s Disease, ALS = Amyotrophic Lateral Sclerosis, ADHD = Attention Deficit Hyperactivity Disorder, ASD = Autism Spectrum Disorder. Dark purple and purple represent a significant Z-score over 1.96, whereas light purple, gray and light green represent an insignificant Z-score, and green represents a significant negative association with a Z-score less than −1.96. C. Z-scores for the enrichment of GWAS SNPs in the open chromatin of Ex, In, Oli, OPC, Ast, End, Mic, populations were overlaid onto the cell clusters. Six brain disorders are shown. D. Z-scores for the enrichment of GWAS SNPs in open chromatin of three excitatory sub-clusters and two inhibitory sub-clusters. Z-score color representation as in (B). E. Percent overlap of published bulk microglia ATAC-seq data with differential peaks for each cell population identified from scTHS-seq data. F. Comparison of GWAS SNPs enrichment in open chromatin from published bulk microglia ATAC-seq data and differential open chromatin regions from scTHS-seq microglia data. G. Visualization of combined scTHS-seq data and published bulk ATAC-seq data on microglia over the gene and promoter region of Alzheimer’s disease associated gene of BIN1. The putative AD causal SNP located in a PU.1 binding footprint is also denoted.

Comment in

References

    1. Grindberg RV, et al. RNA-sequencing from single nuclei. Proc Natl Acad Sci U S A. 2013;110:19802–19807. - PMC - PubMed
    1. Habib N, et al. Div-Seq: Single-nucleus RNA-Seq reveals dynamics of rare adult newborn neurons. Science. 2016;353:925–928. - PMC - PubMed
    1. Krishnaswami SR, et al. Using single nuclei for RNA-seq to capture the transcriptome of postmortem neurons. Nat Protoc. 2016;11:499–524. - PMC - PubMed
    1. Lake BB, et al. Neuronal subtypes and diversity revealed by single-nucleus RNA sequencing of the human brain. Science. 2016;352:1586–1590. - PMC - PubMed
    1. Lacar B, et al. Nuclear RNA-seq of single neurons reveals molecular signatures of activation. Nat Commun. 2016;7:11022. - PMC - PubMed

Publication types