. 2017 Dec 11:77:21.12.1-21.12.12.
doi: 10.1002/cpcb.36.

Fluorescence Lifetime Imaging of a Caspase-3 Apoptosis Reporter

Affiliations

Fluorescence Lifetime Imaging of a Caspase-3 Apoptosis Reporter

Johanna M Buschhaus et al. Curr Protoc Cell Biol. .

Abstract

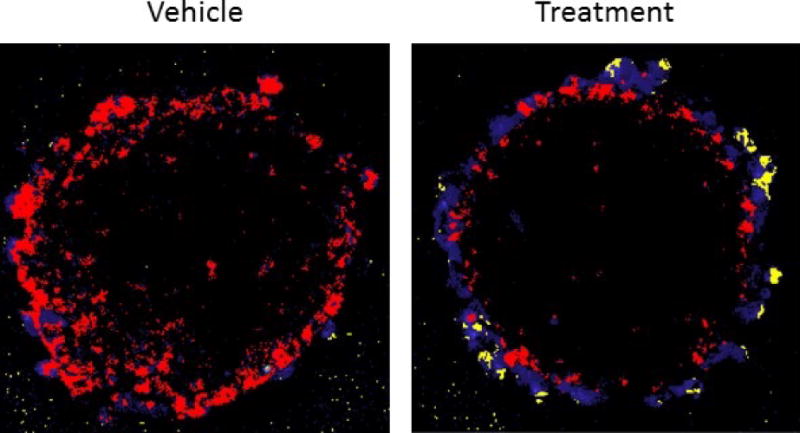
Caspase-3 is a proteolytic enzyme that functions as a key effector in apoptotic cell death. Determining activity of caspase-3 provides critical information about cancer cell viability and response to treatment. To measure apoptosis in intact cells and living mice, a fluorescence imaging reporter that detects caspase-3 activity by Förster resonance energy transfer (FRET) was used. Changes in FRET by fluorescence lifetime imaging microscopy (FLIM) were measured. Unlike FRET measurements based on fluorescence intensity, lifetime measurements are independent of reporter concentration and scattering of light in tissue, making FLIM a robust method for imaging in 3D environments. Apoptosis of breast cancer cells in 2D culture, spheroids, and in vivo murine breast tumor xenografts in response to a variety of genetic and pharmacologic methods implicated in apoptosis of cancer cells was studied. This approach for quantifying apoptosis of cancer cells is based on caspase-3 activity at single-cell resolution using FLIM. © 2017 by John Wiley & Sons, Inc.

Keywords: Förster resonance energy transfer; apoptosis; breast cancer; caspase-3; fluorescence lifetime imaging.


Figures

Figure 1
Figure 1. Representative data of caspase-3 activity of DCA-treated cells in 2D culture with and without glutamine
Image shows FLIM image pseudo-colored by fluorescence lifetime. Yellow pixels correspond to a shorter lifetime indicating cleavage of the DEVD sequence and apoptosis. Red pixels indicate a longer lifetime and greater interaction of the FRET pair. MDA-MB-231 cells were treated with DCA to decrease the rate of glycolysis within the cells. Cells in glutamine-containing media showed minimal caspase-3 activity (increased proportion of red vs. yellow pixels). Cells in glutamine-deprived media showed increased caspase-3 activity (increased proportion of yellow vs. red pixels). White arrow shows a cell clearly undergoing apoptosis as displayed by FLIM. Blue pixels represent background fluorescence.
Figure 2
Figure 2. FLIM images of HS-5 bone marrow stromal cells cultured with MDA-MB-231 breast cancer cells to form 3D spheroids
Spheroids pseudo-colored by fluorescence lifetime with yellow pixels indicating caspase-3 activity and red pixels indicating greater FRET from the intact reporter. The spheroid treated only with vehicle control showed minimal cleavage of the DEVD sequence and apoptotic signal. The spheroid treated with trametinib displayed increased caspase-3 activity and apoptosis. Apoptosis is most apparent on the periphery of the spheroid, indicating a differential spatial response of this treatment in a 3D spheroid environment.
Figure 3
Figure 3. Representative in vivo FLIM images of orthotopic xenografts of MDA-MB-231 cells
We treated mice with either vehicle control or the MEK inhibitor trametinib. Image shows FLIM image pseudo-colored by fluorescence lifetime. Yellow pixels correspond to a shorter lifetime indicating cleavage of the DEVD sequence and apoptosis. Red pixels indicate a longer lifetime from the intact caspase-3 FRET reporter. The vehicle mouse tumor has a higher proportion of red than yellow pixels with no large areas of yellow pixels, indicating a longer average lifetime and less apoptosis in this tumor. The trametinib mouse tumor has a higher proportion of yellow than red pixels indicating a shorter average lifetime, increased caspase-3 activity, and apoptosis. The large area of yellow pixels indicates two apoptotic cells (white arrows).
Figure 4
Figure 4. Energy plot from Seahorse metabolic flux data
We incubated MDA-MB-231 reporter cells under conditions of base DMEM with 1% glutamine (Gln) only, 1% glucose only (no Gln), or with 40 mM DCA. The y-axis shows the oxygen consumption rate (OCR) and the x-axis shows the extracellular acidification rate (ECAR). These are measures of oxidative phosphorylation and glycolysis, respectively.

References

    1. Bouchier-Hayes L, Muñoz-Pinedo C, Connell S, Green DR. Measuring Apoptosis at the Single Cell Level. Methods (San Diego, Calif) 2008;44(3):222–228. doi: 10.1016/j.ymeth.2007.11.007. - DOI - PMC - PubMed
    1. Cavnar S, Salomonsson E, Luker K, Luker G, Takayama S. Transfer, imaging, and analysis plate for facile handling of 384 hanging drop 3D tissue spheroids. J Lab Autom. 2014;19(2):208–214. - PMC - PubMed
    1. Hoppe A, Christensen K, Swanson JA. Fluorescence resonance energy transfer-based stoichiometry in living cells. Biophysical Journal. 2002;83(6):3652–3664. - PMC - PubMed
    1. Jares-Erijman EA, Jovin TM. FRET imaging. Nat Biotech. 2003;21(11):1387–1395. - PubMed
    1. Kerr JFR, Wyllie AH, Currie AR. Apoptosis: a basic biological phenomenon with wide-ranging implications in tissue kinetics. Br J Cancer. 1972;26(4):239–257. - PMC - PubMed