

Microscopic investigation of" topically applied nanoparticles for molecular imaging of fresh tissue surfaces
- PMID: 29227576
- PMCID: PMC5903997
- DOI: 10.1002/jbio.201700246
Microscopic investigation of" topically applied nanoparticles for molecular imaging of fresh tissue surfaces
Abstract
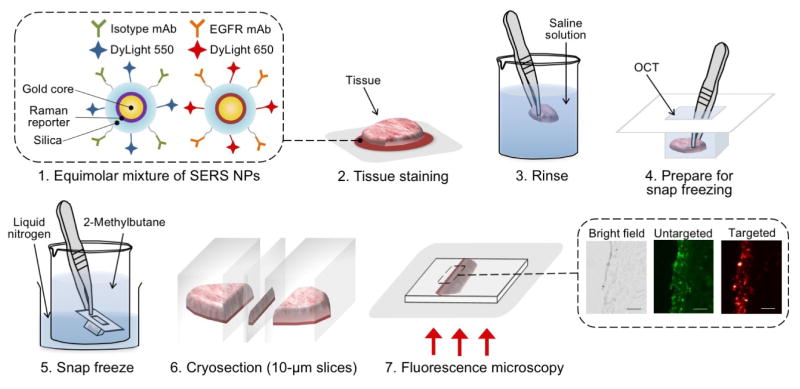
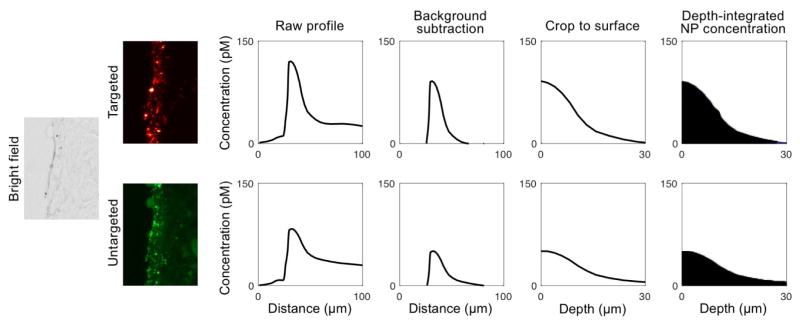
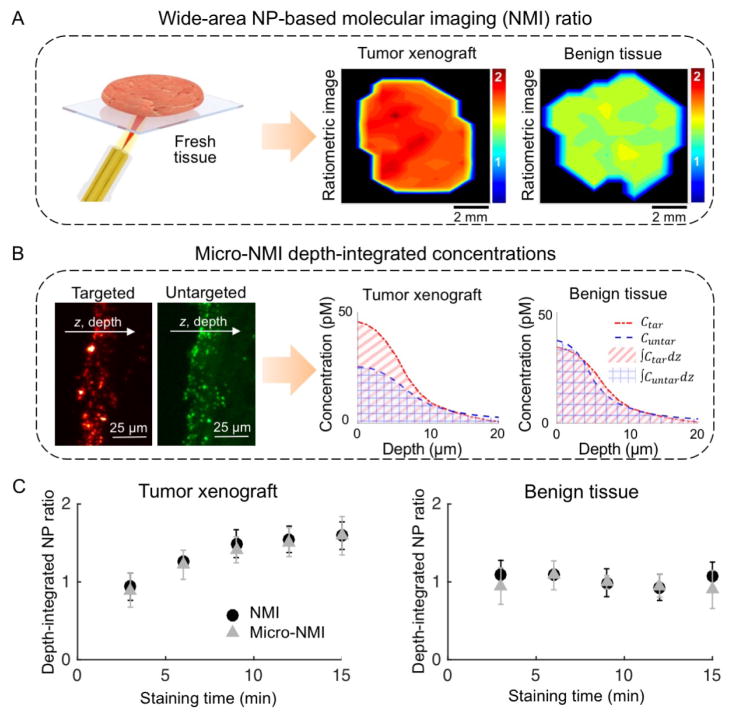
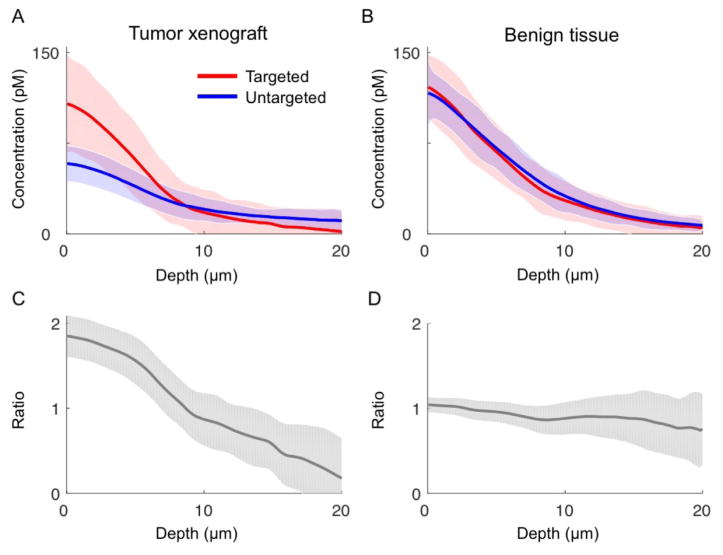
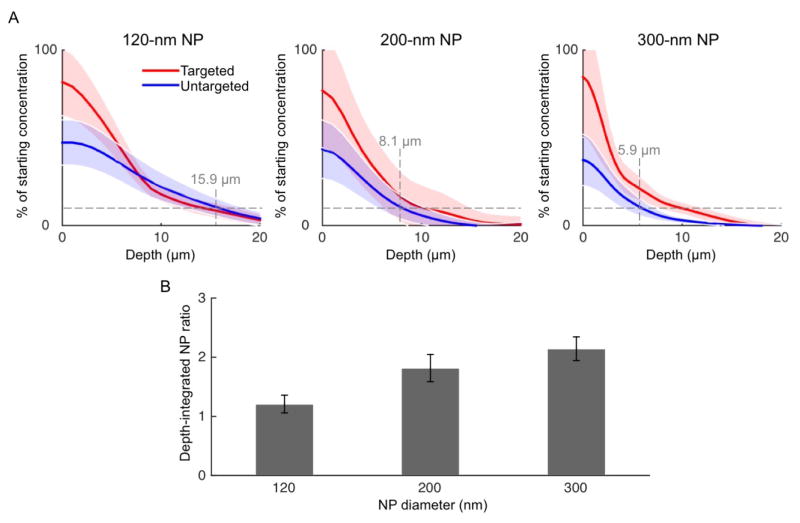
Previous studies have shown that functionalized nanoparticles (NPs) topically applied on fresh tissues are able to rapidly target cell-surface protein biomarkers of cancer. Furthermore, studies have shown that a paired-agent approach, in which an untargeted NP is co-administered with a panel of targeted NPs, controls for the nonspecific behavior of the NPs, enabling quantitative imaging of biomarker expression. However, given the complexities in nonspecific accumulation, diffusion, and chemical binding of targeted NPs in tissues, studies are needed to better understand these processes at the microscopic scale. Here, fresh tissues were stained with a paired-agent approach, frozen, and sectioned to image the depth-dependent accumulation of targeted and untargeted NPs. The ratio of targeted-to-untargeted NP concentrations-a parameter used to distinguish between tumor and benign tissues-was found to diminish with increasing NP diffusion depths due to nonspecific accumulation and poor washout. It was then hypothesized and experimentally demonstrated that larger NPs would exhibit less diffusion below tissue surfaces, enabling higher targeted-to-untargeted NP ratios. In summary, these methods and investigations have enabled the design of NP agents with improved sensitivity and contrast for rapid molecular imaging of fresh tissues.
Keywords: Raman spectroscopy; SERS nanoantennas; SERS nanotags; biomedical optical imaging; molecular imaging; nanomedicine; nanoparticle; optical tags.
© 2017 WILEY-VCH Verlag GmbH & Co. KGaA, Weinheim.
Figures
Similar articles
-
Modeling the binding and diffusion of receptor-targeted nanoparticles topically applied on fresh tissue specimens.Phys Med Biol. 2019 Feb 18;64(4):045013. doi: 10.1088/1361-6560/aaff81. Phys Med Biol. 2019. PMID: 30654346 Free PMC article.
-
Multiplexed Molecular Imaging of Fresh Tissue Surfaces Enabled by Convection-Enhanced Topical Staining with SERS-Coded Nanoparticles.Small. 2016 Oct;12(40):5612-5621. doi: 10.1002/smll.201601829. Epub 2016 Aug 29. Small. 2016. PMID: 27571395 Free PMC article.
-
Surgical Guidance via Multiplexed Molecular Imaging of Fresh Tissues Labeled with SERS-Coded Nanoparticles.IEEE J Sel Top Quantum Electron. 2016 Jul-Aug;22(4):6802911. doi: 10.1109/JSTQE.2015.2507358. Epub 2016 Mar 21. IEEE J Sel Top Quantum Electron. 2016. PMID: 27524875 Free PMC article.
-
Surface engineering of inorganic nanoparticles for imaging and therapy.Adv Drug Deliv Rev. 2013 May;65(5):622-48. doi: 10.1016/j.addr.2012.08.015. Epub 2012 Sep 6. Adv Drug Deliv Rev. 2013. PMID: 22975010 Review.
-
Self-assembled targeted nanoparticles: evolution of technologies and bench to bedside translation.Acc Chem Res. 2011 Oct 18;44(10):1123-34. doi: 10.1021/ar200054n. Epub 2011 Jun 21. Acc Chem Res. 2011. PMID: 21692448 Review.
Cited by
-
Rapid pathology of lumpectomy margins with open-top light-sheet (OTLS) microscopy.Biomed Opt Express. 2019 Feb 19;10(3):1257-1272. doi: 10.1364/BOE.10.001257. eCollection 2019 Mar 1. Biomed Opt Express. 2019. PMID: 30891344 Free PMC article.
-
Modeling the binding and diffusion of receptor-targeted nanoparticles topically applied on fresh tissue specimens.Phys Med Biol. 2019 Feb 18;64(4):045013. doi: 10.1088/1361-6560/aaff81. Phys Med Biol. 2019. PMID: 30654346 Free PMC article.
-
Diagnostic Performance of Receptor-Specific Surgical Specimen Staining Correlate with Receptor Expression Level.Proc SPIE Int Soc Opt Eng. 2019 Feb;10862:108620K. doi: 10.1117/12.2510625. Epub 2019 Mar 7. Proc SPIE Int Soc Opt Eng. 2019. PMID: 32273644 Free PMC article.
-
Ratiometric optical nanoprobes enable accurate molecular detection and imaging.Chem Soc Rev. 2018 Apr 23;47(8):2873-2920. doi: 10.1039/C7CS00612H. Chem Soc Rev. 2018. PMID: 29568836 Free PMC article. Review.
-
Diagnostic performance of receptor-specific surgical specimen staining correlates with receptor expression level.J Biomed Opt. 2019 Feb;24(2):1-9. doi: 10.1117/1.JBO.24.2.026002. J Biomed Opt. 2019. PMID: 30737910 Free PMC article.
References
Publication types
MeSH terms
Substances
Grants and funding
LinkOut - more resources
Full Text Sources
Other Literature Sources
Miscellaneous
