Expanding Proteoform Identifications in Top-Down Proteomic Analyses by Constructing Proteoform Families
- PMID: 29227670
- PMCID: PMC5807004
- DOI: 10.1021/acs.analchem.7b04221
Expanding Proteoform Identifications in Top-Down Proteomic Analyses by Constructing Proteoform Families
Abstract
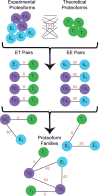
In top-down proteomics, intact proteins are analyzed by tandem mass spectrometry and proteoforms, which are defined forms of a protein with specific sequences of amino acids and localized post-translational modifications, are identified using precursor mass and fragmentation data. Many proteoforms that are detected in the precursor scan (MS1) are not selected for fragmentation by the instrument and therefore remain unidentified in typical top-down proteomic workflows. Our laboratory has developed the open source software program Proteoform Suite to analyze MS1-only intact proteoform data. Here, we have adapted it to provide identifications of proteoform masses in precursor MS1 spectra of top-down data, supplementing the top-down identifications obtained using the MS2 fragmentation data. Proteoform Suite performs mass calibration using high-scoring top-down identifications and identifies additional proteoforms using calibrated, accurate intact masses. Proteoform families, the set of proteoforms from a given gene, are constructed and visualized from proteoforms identified by both top-down and intact-mass analyses. Using this strategy, we constructed proteoform families and identified 1861 proteoforms in yeast lysate, yielding an approximately 40% increase over the original 1291 proteoform identifications observed using traditional top-down analysis alone.
Figures


Similar articles
-
Proteoform Analysis and Construction of Proteoform Families in Proteoform Suite.Methods Mol Biol. 2022;2500:67-81. doi: 10.1007/978-1-0716-2325-1_7. Methods Mol Biol. 2022. PMID: 35657588 Free PMC article.
-
Improving Proteoform Identifications in Complex Systems Through Integration of Bottom-Up and Top-Down Data.J Proteome Res. 2020 Aug 7;19(8):3510-3517. doi: 10.1021/acs.jproteome.0c00332. Epub 2020 Jul 10. J Proteome Res. 2020. PMID: 32584579 Free PMC article.
-
Intact Mass Proteomics Using a Proteoform Atlas.J Proteome Res. 2025 Jan 3;24(1):323-332. doi: 10.1021/acs.jproteome.4c00838. Epub 2024 Dec 11. J Proteome Res. 2025. PMID: 39661499
-
Identification and Quantification of Proteoforms by Mass Spectrometry.Proteomics. 2019 May;19(10):e1800361. doi: 10.1002/pmic.201800361. Proteomics. 2019. PMID: 31050378 Free PMC article. Review.
-
Top-Down Proteomics and the Challenges of True Proteoform Characterization.J Proteome Res. 2023 Dec 1;22(12):3663-3675. doi: 10.1021/acs.jproteome.3c00416. Epub 2023 Nov 8. J Proteome Res. 2023. PMID: 37937372 Free PMC article. Review.
Cited by
-
Mass Spectrometry-Based Proteomic Technology and Its Application to Study Skeletal Muscle Cell Biology.Cells. 2023 Nov 1;12(21):2560. doi: 10.3390/cells12212560. Cells. 2023. PMID: 37947638 Free PMC article. Review.
-
Proteoform Analysis and Construction of Proteoform Families in Proteoform Suite.Methods Mol Biol. 2022;2500:67-81. doi: 10.1007/978-1-0716-2325-1_7. Methods Mol Biol. 2022. PMID: 35657588 Free PMC article.
-
Evaluation of linear models and missing value imputation for the analysis of peptide-centric proteomics.BMC Bioinformatics. 2019 Mar 14;20(Suppl 2):102. doi: 10.1186/s12859-019-2619-6. BMC Bioinformatics. 2019. PMID: 30871482 Free PMC article.
-
Proteoform Suite: Software for Constructing, Quantifying, and Visualizing Proteoform Families.J Proteome Res. 2018 Jan 5;17(1):568-578. doi: 10.1021/acs.jproteome.7b00685. Epub 2017 Dec 15. J Proteome Res. 2018. PMID: 29195273 Free PMC article.
-
Identification and Quantification of Murine Mitochondrial Proteoforms Using an Integrated Top-Down and Intact-Mass Strategy.J Proteome Res. 2018 Oct 5;17(10):3526-3536. doi: 10.1021/acs.jproteome.8b00469. Epub 2018 Sep 18. J Proteome Res. 2018. PMID: 30180576 Free PMC article.
References
-
- Yang X, Coulombe-Huntington J, Kang S, Sheynkman GM, Hao T, Richardson A, Sun S, Yang F, Shen YA, Murray RR, Spirohn K, Begg BE, Duran-Frigola M, MacWilliams A, Pevzner SJ, Zhong Q, Trigg SA, Tam S, Ghamsari L, Sahni N, Yi S, Rodriguez MD, Balcha D, Tan G, Costanzo M, Andrews B, Boone C, Zhou XJ, Salehi-Ashtiani K, Charloteaux B, Chen AA, Calderwood MA, Aloy P, Roth FP, Hill DE, Iakoucheva LM, Xia Y, Vidal M. Cell. 2016;164:805–817. - PMC - PubMed
-
- Jenuwein T, Allis CD. Science. 2001;293:1074–1080. - PubMed
Publication types
MeSH terms
Substances
Grants and funding
LinkOut - more resources
Full Text Sources
Other Literature Sources
Molecular Biology Databases

