. 2017 Dec 11;13(12):e1005879.
doi: 10.1371/journal.pcbi.1005879. eCollection 2017 Dec.

Thalamocortical control of propofol phase-amplitude coupling

Affiliations

Thalamocortical control of propofol phase-amplitude coupling

Austin E Soplata et al. PLoS Comput Biol. .

Abstract

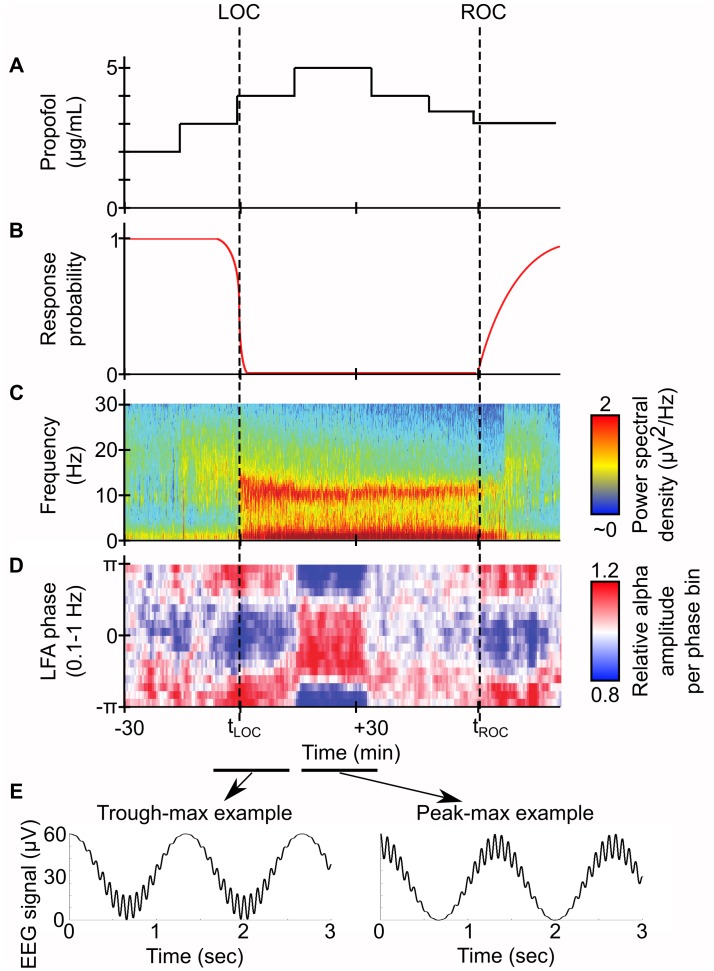
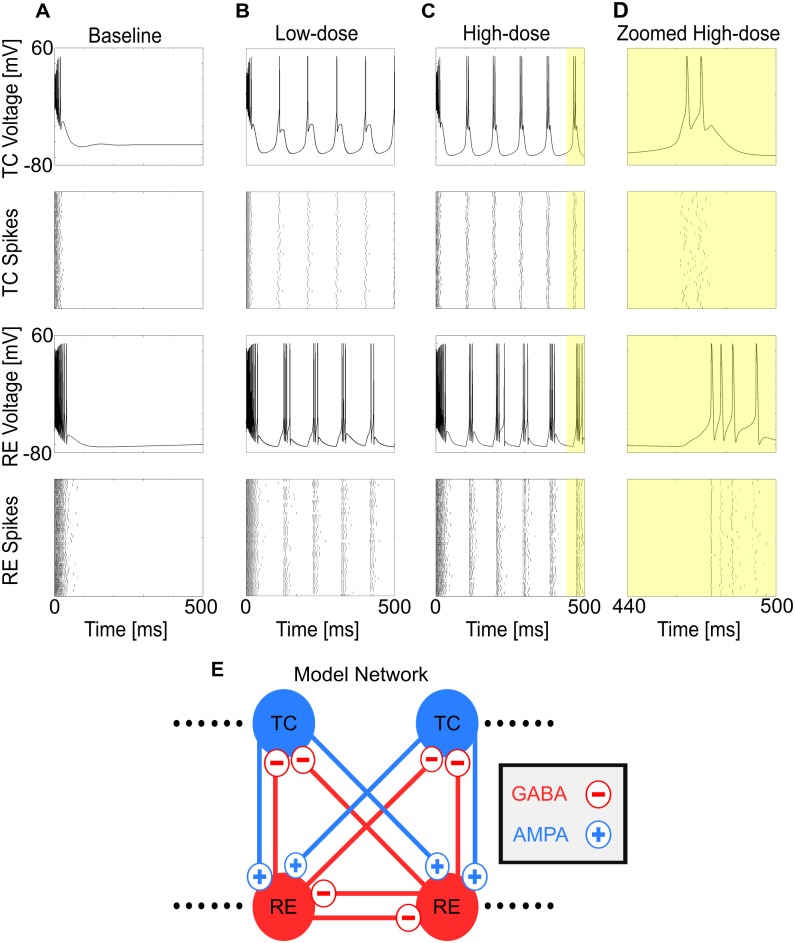
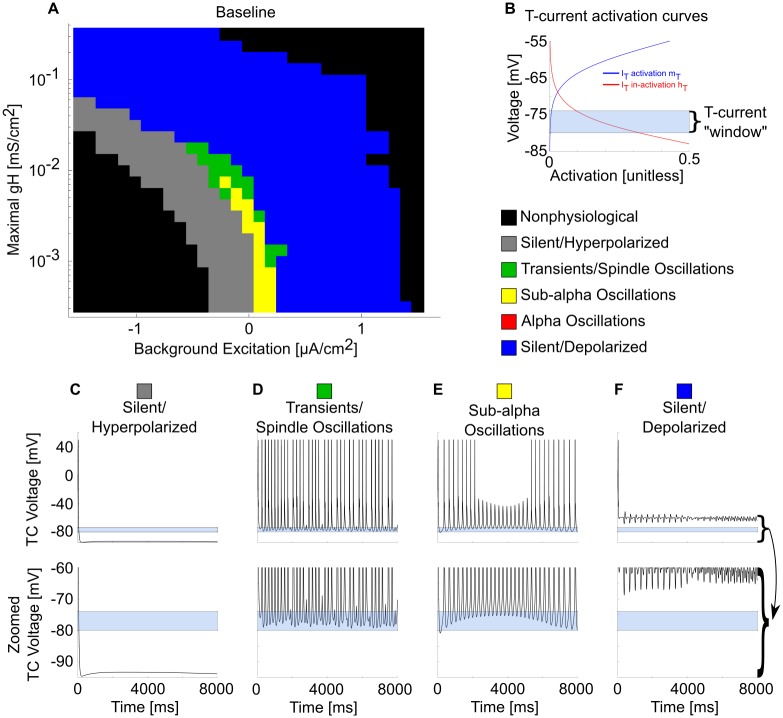
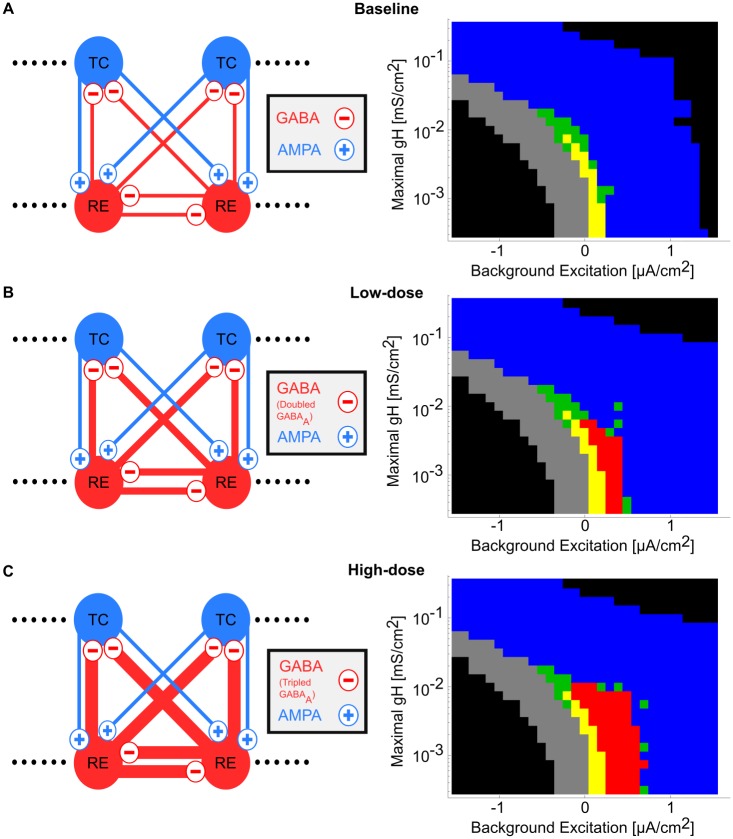
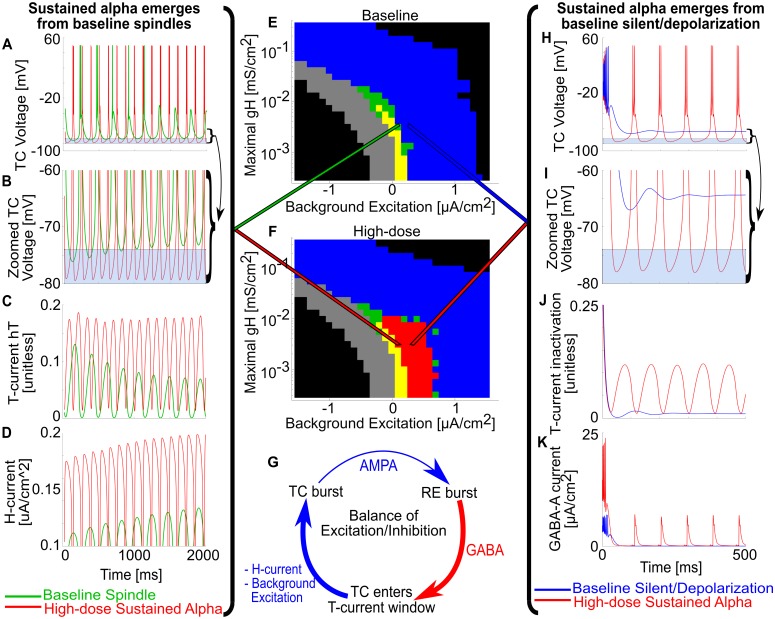
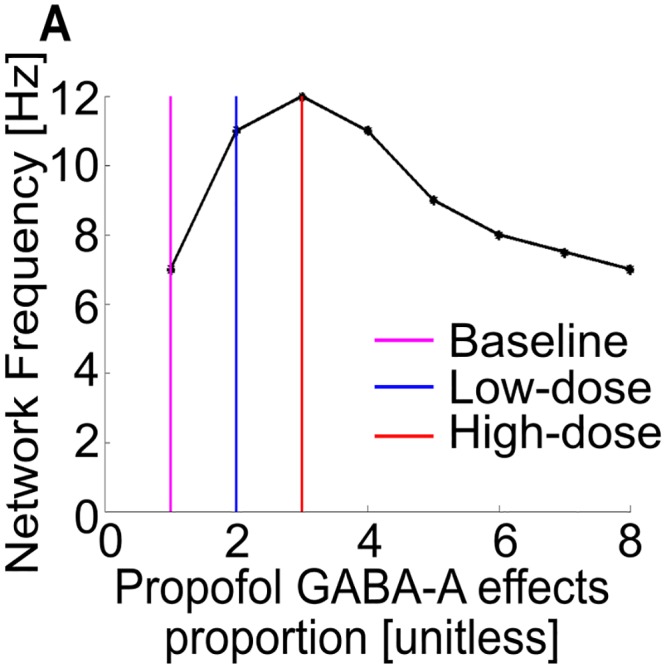
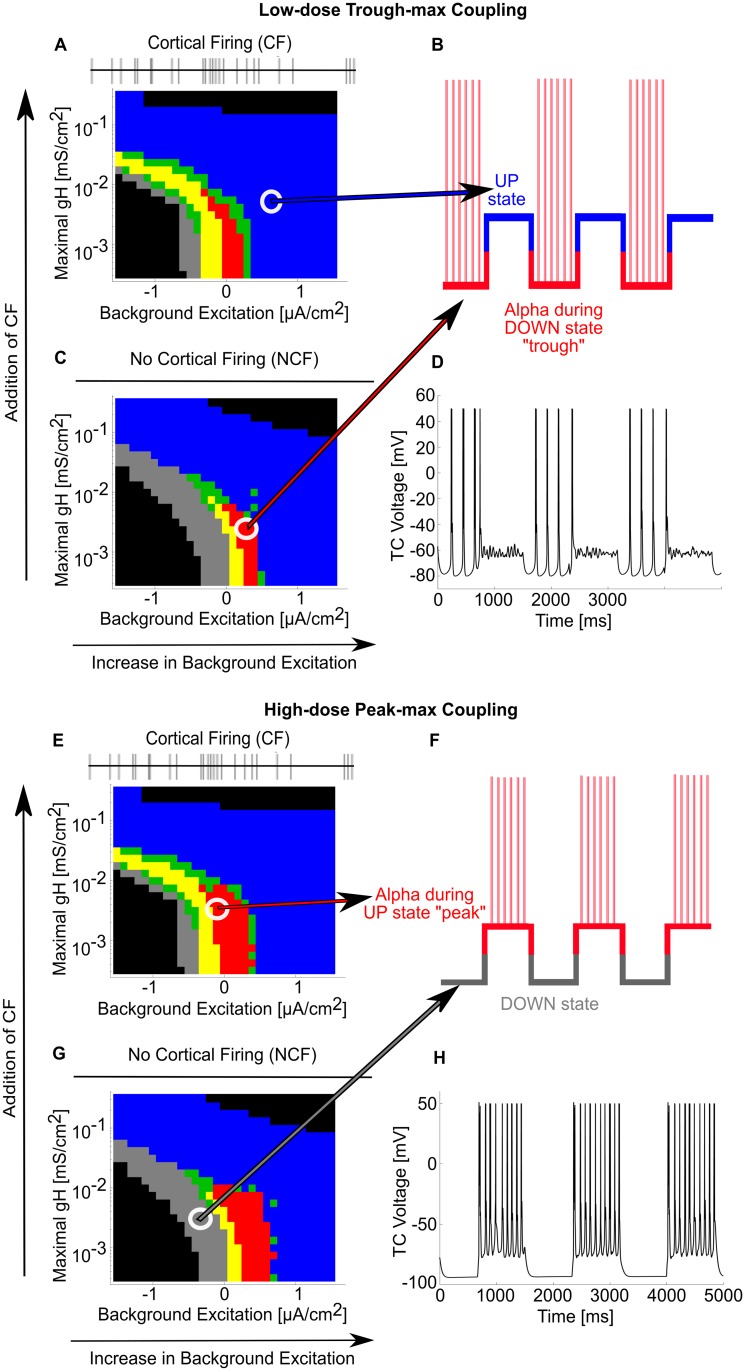
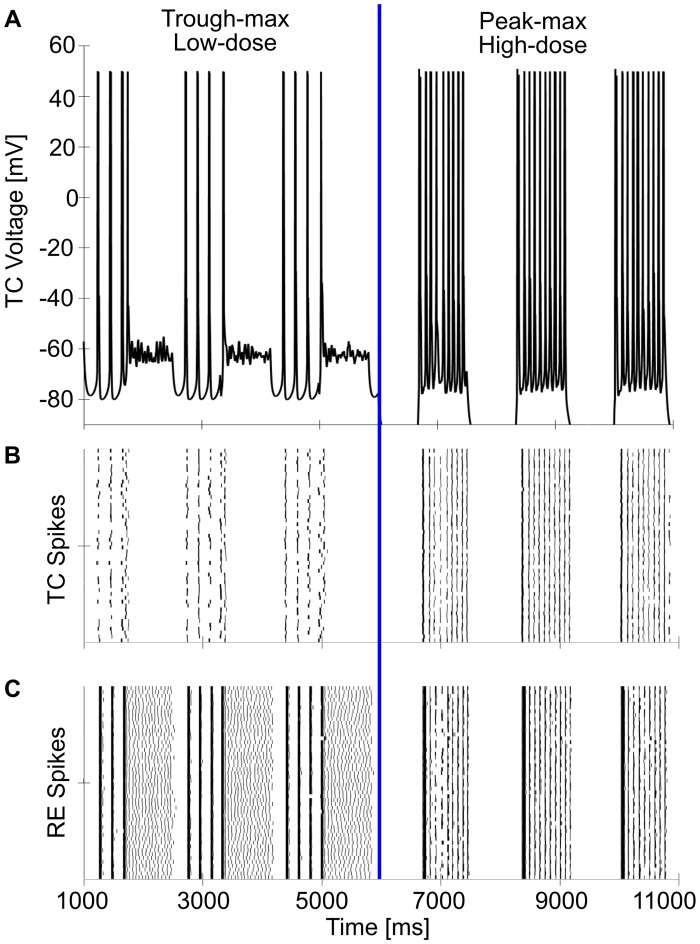
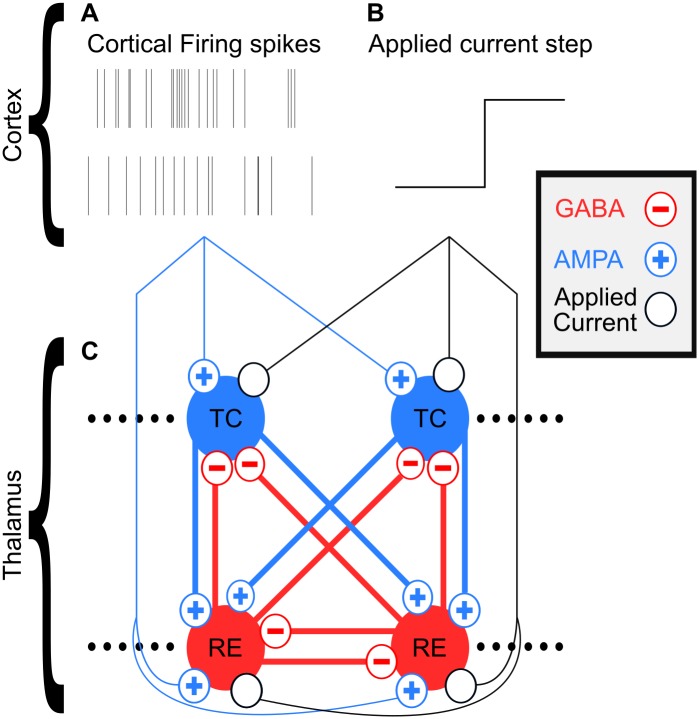
The anesthetic propofol elicits many different spectral properties on the EEG, including alpha oscillations (8-12 Hz), Slow Wave Oscillations (SWO, 0.1-1.5 Hz), and dose-dependent phase-amplitude coupling (PAC) between alpha and SWO. Propofol is known to increase GABAA inhibition and decrease H-current strength, but how it generates these rhythms and their interactions is still unknown. To investigate both generation of the alpha rhythm and its PAC to SWO, we simulate a Hodgkin-Huxley network model of a hyperpolarized thalamus and corticothalamic inputs. We find, for the first time, that the model thalamic network is capable of independently generating the sustained alpha seen in propofol, which may then be relayed to cortex and expressed on the EEG. This dose-dependent sustained alpha critically relies on propofol GABAA potentiation to alter the intrinsic spindling mechanisms of the thalamus. Furthermore, the H-current conductance and background excitation of these thalamic cells must be within specific ranges to exhibit any intrinsic oscillations, including sustained alpha. We also find that, under corticothalamic SWO UP and DOWN states, thalamocortical output can exhibit maximum alpha power at either the peak or trough of this SWO; this implies the thalamus may be the source of propofol-induced PAC. Hyperpolarization level is the main determinant of whether the thalamus exhibits trough-max PAC, which is associated with lower propofol dose, or peak-max PAC, associated with higher dose. These findings suggest: the thalamus generates a novel rhythm under GABAA potentiation such as under propofol, its hyperpolarization may determine whether a patient experiences trough-max or peak-max PAC, and the thalamus is a critical component of propofol-induced cortical spectral phenomena. Changes to the thalamus may be a critical part of how propofol accomplishes its effects, including unconsciousness.


Conflict of interest statement

I have read the journal's policy and the authors of this manuscript have the following competing interests: ENB and PLP are inventors on patents pending on anesthetic brain monitoring that have been licensed by Massachusetts General Hospital to Masimo Corporation. ENB and PLP have received speaker’s honoraria from and ENB has consulted for Masimo Corporation.

Figures

Fig 1
Fig 1. Propofol PAC in EEG profile of stepwise-increasing propofol dose in human volunteers and accompanying illustrations.
(A) Illustration of theoretical propofol dose. (B) Illustration of theoretical response profile to auditory cues. (C) Spectrogram of frontal EEG during patient propofol administration. Note the alpha and SWO power between LOC and ROC. (D) PAC modulation of alpha amplitude to SWO phase for same patient. Note the strong, stereotyped trough-max PAC when LOC occurs, and the subsequent 180 degree shift in PAC to peak-max upon deeper propofol administration. (E) Illustration of theoretical EEG traces from representative signals of either PAC regime. Based on Figure 1 of [12].
Fig 2
Fig 2. Propofol enables sustained alpha firing in thalamus.
(A) Representative voltage traces and spike rastergrams of TC and RE cells under baseline (no propofol) conditions. (B) Representative voltage traces and spike rastergrams of TC and RE cells under the same conditions, except for low-dose propofol potentiation of GABAA. (C) Representative voltage traces and spike rastergrams of TC and RE cells under the same conditions, except for high-dose propofol potentiation of GABAA. (D) Zoom of C, illustrating time course of a single alpha TC-RE burst. (E) Simplified connection matrix of the 50TC-50RE simulations used.
Fig 3
Fig 3. Many thalamic oscillations, but not sustained alpha, occur across the baseline gH-background excitation plane.
(A) Behavioral regimes of baseline thalamic simulations across all physiological values of the gH-background excitation plane. Each simulation is represented by a pixel, colored according to its manually classified behavioral regime. Note the lack of sustained alpha (red) firing. (B) TC cell T-current de-inactivation "window" illustrated by the sum of steady-state activation (mT, blue) and de-inactivation (hT, red) curves. In our model, activation mT is always at steady-state, while the de-inactivation hT state variable must remain high enough for long enough to enable a spiking T-current burst. (C) Representative TC cell voltage trace during a silent, hyperpolarized stimulation and its zoom near the T-current de-inactivation window. (D) Representative TC cell voltage trace during a spindling simulation and its zoom. (E) Representative TC cell voltage trace during a sub-alpha simulation and its zoom. (F) Representative TC cell voltage trace during a silent, depolarized simulation and its zoom.
Fig 4
Fig 4. Propofol potentiation of gGABAA and τGABAA enables sustained alpha oscillations on the gH-background excitation plane.
(A) Model network and behavioral regimes of simulations across the gH-background excitation plane under baseline. See Fig 3 for behavior regime legend. (B) Model network and behavioral regimes of simulations across the gH-background excitation plane under low-dose propofol. Note the presence of sustained alpha (red) simulations. (C) Model network and behavioral regimes of simulations across the gH-background excitation plane under high-dose propofol.
Fig 5
Fig 5. Propofol gGABAA potentiation enables sustained alpha by changing the balance of excitation and inhibition.
(A) Representative TC voltage traces for the same gH-background excitation state under either baseline spindling (green trace) or high-dose propofol sustained alpha (red trace). (B) Zoom of A around T-current de-inactivation window. Baseline spindles terminate from H-current up-regulation, which raises the minima of TC cell voltage outside the T-current de-inactivation window. Under high-dose propofol gGABAA potentiation, the TC cell voltage floor does not rise from the window. (C) Representative TC cell T-current de-inactivation state variables (hT) for baseline and high-dose. Note that baseline spindles stop spiking once the hT maxima are below a threshold. (D) Representative TC cell H-current magnitude of baseline and high-dose. Note that baseline spindles stop spiking once H-current magnitude is high enough, but high-dose sustained alpha continues to spike even with a stronger realized H-current. (E) gH-background excitation plane for baseline simulations. (F) gH-background excitation plane for high-dose propofol simulations. (G) Illustration of the intrinsic TC-RE oscillation cycle; propofol gGABAA potentiation and negative background excitation enhance the RE burst inhibition, while H-current and positive background excitation augment the time from TC voltage minimum to TC bursting. (H) Representative TC voltage traces for the same gH-background excitation state under either baseline silent depolarization (blue trace) or high-dose propofol sustained alpha (red trace). (I) Zoom of H around T-current de-inactivation window; baseline never enters the T-current window, and therefore does not oscillate. (J) Representative TC cell T-current de-inactivation state variables for baseline and high-dose. (K) Representative TC cell H-current magnitude of baseline and high-dose.
Fig 6
Fig 6. Maximum network frequencies under TC cell propofol multiplier extremes.
(A) The maximum network frequency peaks at high-dose levels of gGABAA potentiation, where gGABAA and τGABAA are tripled. Increasing the gGABAA potentiation further to extreme, possibly non-physiological values, only decreases the maximum network frequency.
Fig 7
Fig 7. Propofol PAC regimes can be modeled as SWO connections between different gH-background excitation planes.
(A) Behavioral regimes of simulations across the gH-background excitation plane under low-dose propofol with no cortical firing (NCF). See Fig 3 for behavior regime legend. (B) Illustration of where each CF and NCF state lies on the SWO for trough-max: the blue, silent, depolarized CF state occurs during the corticothalamic SWO UP state, while the red, sustained alpha NCF state occurs during the corticothalamic SWO DOWN state. (C) Behavioral regimes simulations across the gH-background excitation plane under low-dose propofol with cortical firing (CF). (D) Representative TC cell voltage during SWO oscillation between the two states indicated in (A) and (C), illustrating trough-max. (E) Behavioral regimes of simulations across the gH-background excitation plane under high-dose propofol with NCF. (F) Illustration of where each CF and NCF state lies on the SWO for peak-max. (G) Behavioral regimes simulations across the gH-background excitation plane under high-dose propofol with CF. (H) Representative TC cell voltage during SWO oscillation between the two states indicated in (E) and (G), illustrating peak-max.
Fig 8
Fig 8. Single simulation illustrating trough-max and the switch to peak-max.
(A) Representative TC cell voltage across trough-max and peak-max. At the halfway point (6 seconds), the switch from low-dose to high-dose propofol is simulated by increasing gGABAA potentiation from double to triple of baseline and reducing background excitation. (B) Rastergram of the 50 TC cells, illustrating the high synchrony across the network. (C) Rastergram of the 50 RE cells, illustrating their high synchrony.
Fig 9
Fig 9. Diagram illustrating thalamic network model and its cortical inputs.
(A) Example 12 Hz Poisson process-generated spiketrains used for corticothalamic UP state spikes. (B) Example background excitation/applied current step used for corticothalamic UP state. (C) Model network of thalamus, its connections, and its inputs from cortex.

Similar articles

Cited by

References

    1. Miller RD, editor. Miller’s anesthesia. Eighth edition Philadelphia, PA: Elsevier/Saunders; 2015.
    1. Ishizawa Y, Ahmed OJ, Patel SR, Gale JT, Sierra-Mercado D, Brown EN, et al. Dynamics of Propofol-Induced Loss of Consciousness Across Primate Neocortex. J Neurosci. 2016;36: 7718–7726. doi: 10.1523/JNEUROSCI.4577-15.2016 - DOI - PMC - PubMed
    1. Brown EN, Purdon PL, Van Dort CJ. General Anesthesia and Altered States of Arousal: A Systems Neuroscience Analysis. Annu Rev Neurosci. 2011;34: 601–628. doi: 10.1146/annurev-neuro-060909-153200 - DOI - PMC - PubMed
    1. Lewis LD, Weiner VS, Mukamel EA, Donoghue JA, Eskandar EN, Madsen JR, et al. Rapid fragmentation of neuronal networks at the onset of propofol-induced unconsciousness. Proc Natl Acad Sci. 2012;109: E3377–E3386. doi: 10.1073/pnas.1210907109 - DOI - PMC - PubMed
    1. Hanrahan SJ, Greger B, Parker RA, Ogura T, Obara S, Egan TD, et al. The Effects of Propofol on Local Field Potential Spectra, Action Potential Firing Rate, and Their Temporal Relationship in Humans and Felines. Front Hum Neurosci. 2013;7 doi: 10.3389/fnhum.2013.00136 - DOI - PMC - PubMed

Publication types