. 2017 Dec 11;12(12):e0189508.
doi: 10.1371/journal.pone.0189508. eCollection 2017.

Brain-to-brain hyperclassification reveals action-specific motor mapping of observed actions in humans

Affiliations

Brain-to-brain hyperclassification reveals action-specific motor mapping of observed actions in humans

Dmitry Smirnov et al. PLoS One. .

Abstract

Seeing an action may activate the corresponding action motor code in the observer. It remains unresolved whether seeing and performing an action activates similar action-specific motor codes in the observer and the actor. We used novel hyperclassification approach to reveal shared brain activation signatures of action execution and observation in interacting human subjects. In the first experiment, two "actors" performed four types of hand actions while their haemodynamic brain activations were measured with 3-T functional magnetic resonance imaging (fMRI). The actions were videotaped and shown to 15 "observers" during a second fMRI experiment. Eleven observers saw the videos of one actor, and the remaining four observers saw the videos of the other actor. In a control fMRI experiment, one of the actors performed actions with closed eyes, and five new observers viewed these actions. Bayesian canonical correlation analysis was applied to functionally realign observers' and actors' fMRI data. Hyperclassification of the seen actions was performed with Bayesian logistic regression trained on actors' data and tested with observers' data. Without the functional realignment, between-subjects accuracy was at chance level. With the realignment, the accuracy increased on average by 15 percentage points, exceeding both the chance level and the accuracy without functional realignment. The highest accuracies were observed in occipital, parietal and premotor cortices. Hyperclassification exceeded chance level also when the actor did not see her own actions. We conclude that the functional brain activation signatures underlying action execution and observation are partly shared, yet these activation signatures may be anatomically misaligned across individuals.


Conflict of interest statement

Competing Interests: The authors have declared that no competing interests exist.

Figures

Fig 1
Fig 1. Experimental design and sample trials of action execution and observation.
A) The actor performed four different actions in the scanner. An actor in the control experiment kept her eyes closed and could not see her own hand actions. B) Trial structure for the actor subjects. C) Trial structure for the observer subjects. Green outline shows the trial portions used for classification. Photographer identified themselves and the purpose of the photograph to the person shown in the photograph, and they agreed to have their photograph taken and potentially published.
Fig 2
Fig 2. Schematic description of data preprocessing and analysis for hyperclassification.
Bayesian canonical correlation was used on preprocessed data to acquire mapping between actor’s and observer’s BOLD signals. Mapping was acquired in cross-validated fashion, where a model was trained on four runs of the actor and the observer. The observer’s left-out run was used in subsequent analysis, where shared representation between actor and observer was mapped to actor’s functional space and used in testing the classifier. Bayesian logistic regression was used as pattern classifier. In within-subject classification training and testing was done using the data from the same individual. In hyperclassification training was done on actor’s data and testing on corresponding observer’s data.
Fig 3
Fig 3. Brain regions showing activation during action execution and observation localizers.
For each subject, the statistical image was thresholded at T > 2 and binarized. Warm colors indicate number of subjects that showed activation during action observation for each voxel, and cold colors during action execution. Purple color shows overlap between action execution and observation. Abbreviations: SPL–Superior Parietal Lobule; SOP–Superior Occipital Pole; SMG–Supramarginal Gyrus; LOC–Lateral Occipital Cortex, SI–primary somatosensory cortex, SII–secondary somatosensory cortex.
Fig 4
Fig 4. Action-specific brain activation.
Brain regions whose activity increased during specific actions (A: Power grip, B: Precision grip, C: Slap, D: Point) during the main experiment. Warm colors indicate activation for observer subjects, cold colors activation for actor subjects, and purple color overlap between the activation maps of actors and observers.
Fig 5
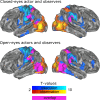
Fig 5. Brain activation during closed-eyes and open-eyes experiments.
Brain regions showing significant activation during action execution and observation in the main experiment for closed-eyes (top) and open-eyes (bottom) conditions for actor and all observers. Warm colors indicate activation for observer subjects; cold colors indicate activation for actor subjects. Purple color indicates overlap between activation maps of actors and observers.
Fig 6
Fig 6. Within-subject classification accuracies.
Means and 95% confidence intervals for within-subject classification of seen actions in different regions of interest (ROIs). Dashed line indicates the chance level.
Fig 7
Fig 7. Hyperclassification and between-subject classification accuracies.
Means and 95% confidence intervals for hyperclassification and between-subjects classification accuracy of seen actions in different regions of interest (ROIs) in the closed-eyes (left) and open-eyes (right) conditions. Dashed line indicates the chance level.
Fig 8
Fig 8. Confusion matrix for functionally realigned hyperclassification with meta-analytic ROI.
Numbers in the cells indicate percentage of action category guesses by classifier. Black frames denote action categories that were correctly classified with above chance level accuracy.
Fig 9
Fig 9. Increases in intersubject correlation and classification accuracy after functional realignment.
A) Cortical regions showing significant increase of intersubject correlation (ISC) between actors and observers after functional realignment. Colorbar denotes the difference in ISC, indicated with T-statistic. Green outline indicates the regions included in meta-analytic ROI. B) Cortical regions showing significant increase in searchlight kNN classification accuracy after functional realignment thresholded with increase of accuracy of more than 5 percentage points. Colorbar denotes the difference of kNN accuracy. Green outline as in A).

References

    1. Gallese V, Fadiga L, Fogassi L, Rizzolatti G. Action recognition in the premotor cortex. 1996; Brain 119:593–609. - PubMed
    1. Hari R, Forss N, Avikainen S, Kirveskari E, Salenius S, Rizzolatti G. Activation of human primary motor cortex during action observation: a neuromagnetic study. 1998; Proc Natl Acad Sci U S A 95:15061–15065. - PMC - PubMed
    1. Rizzolatti G, Craighero L. The mirror-neuron system. 2004; Annu Rev Neurosci 27:169–192. doi: 10.1146/annurev.neuro.27.070203.144230 - DOI - PubMed
    1. Gazzola V, Keysers C. The observation and execution of actions share motor and somatosensory voxels in all tested subjects: single-subject analyses of unsmoothed fMRI data. 2009; Cereb Cortex 19:1239–1255. doi: 10.1093/cercor/bhn181 - DOI - PMC - PubMed
    1. Hari R, Kujala MV. Brain basis of human social interaction: from concepts to brain imaging. 2009; Physiol Rev 89:453–479. doi: 10.1152/physrev.00041.2007 - DOI - PubMed

Publication types

LinkOut - more resources