

SPRING: a kinetic interface for visualizing high dimensional single-cell expression data
- PMID: 29228172
- PMCID: PMC6030950
- DOI: 10.1093/bioinformatics/btx792
SPRING: a kinetic interface for visualizing high dimensional single-cell expression data
Abstract
Motivation: Single-cell gene expression profiling technologies can map the cell states in a tissue or organism. As these technologies become more common, there is a need for computational tools to explore the data they produce. In particular, visualizing continuous gene expression topologies can be improved, since current tools tend to fragment gene expression continua or capture only limited features of complex population topologies.
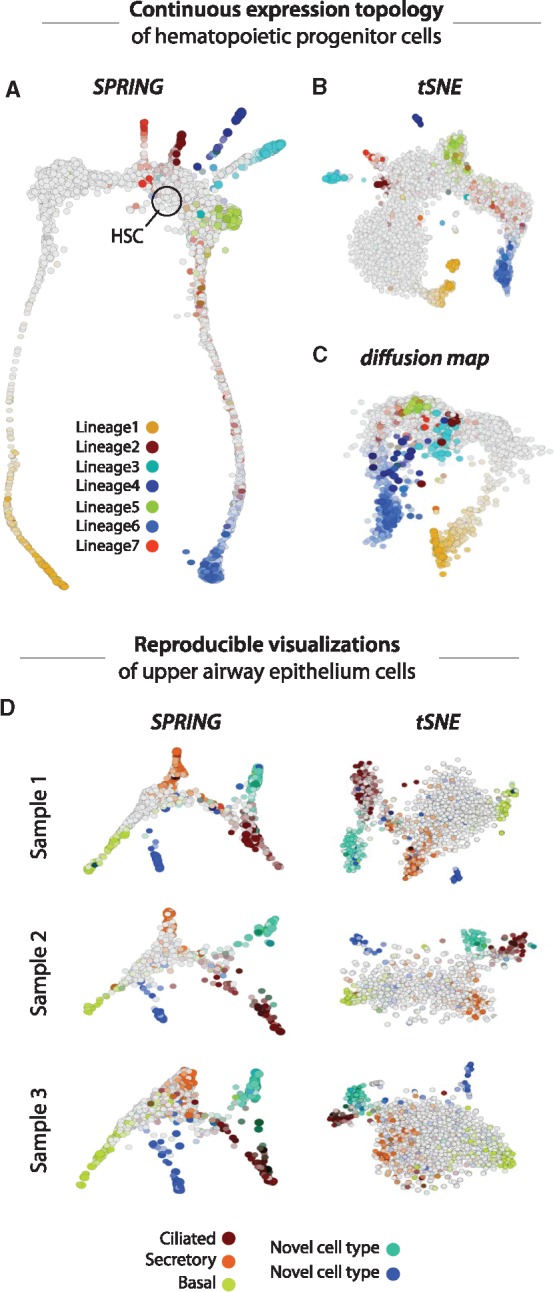
Results: Force-directed layouts of k-nearest-neighbor graphs can visualize continuous gene expression topologies in a manner that preserves high-dimensional relationships and captures complex population topologies. We describe SPRING, a pipeline for data filtering, normalization and visualization using force-directed layouts and show that it reveals more detailed biological relationships than existing approaches when applied to branching gene expression trajectories from hematopoietic progenitor cells and cells of the upper airway epithelium. Visualizations from SPRING are also more reproducible than those of stochastic visualization methods such as tSNE, a state-of-the-art tool. We provide SPRING as an interactive web-tool with an easy to use GUI.
Availability and implementation: https://kleintools.hms.harvard.edu/tools/spring.html, https://github.com/AllonKleinLab/SPRING/.
Contact: calebsw@gmail.com or allon_klein@hms.harvard.edu.
Supplementary information: Supplementary data are available at Bioinformatics online.
Figures
References
-
- Haghverdi L. et al. (2015) Diffusion maps for high-dimensional single-cell analysis of differentiation data. Bioinformatics, 31, 2989–2998. - PubMed
Publication types
MeSH terms
Grants and funding
LinkOut - more resources
Full Text Sources
Other Literature Sources
