Randomized Controlled Trial
. 2018 Jan 1;141(1):271-287.
doi: 10.1093/brain/awx320.

Widespread brain tau and its association with ageing, Braak stage and Alzheimer's dementia

Affiliations
Randomized Controlled Trial

Widespread brain tau and its association with ageing, Braak stage and Alzheimer's dementia

Val J Lowe et al. Brain. .

Abstract

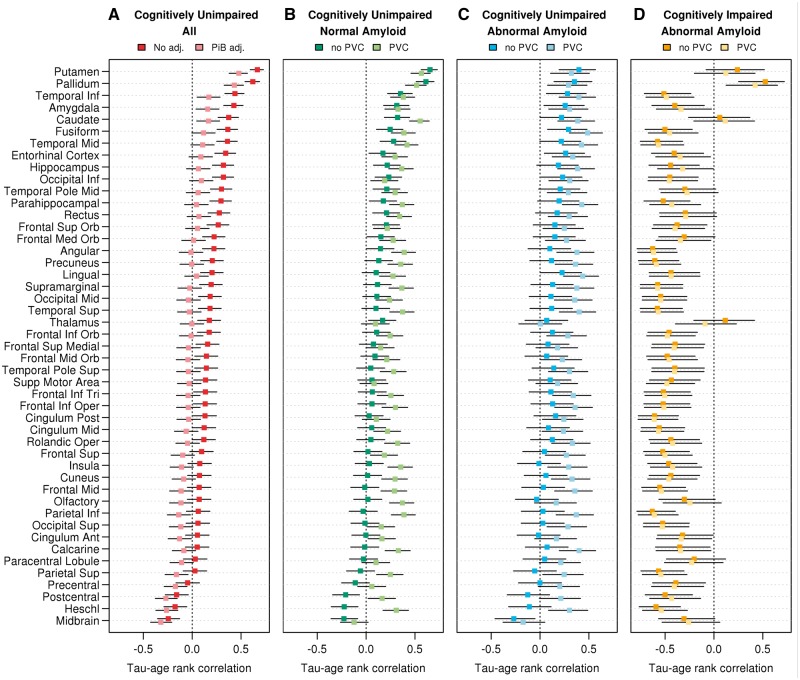
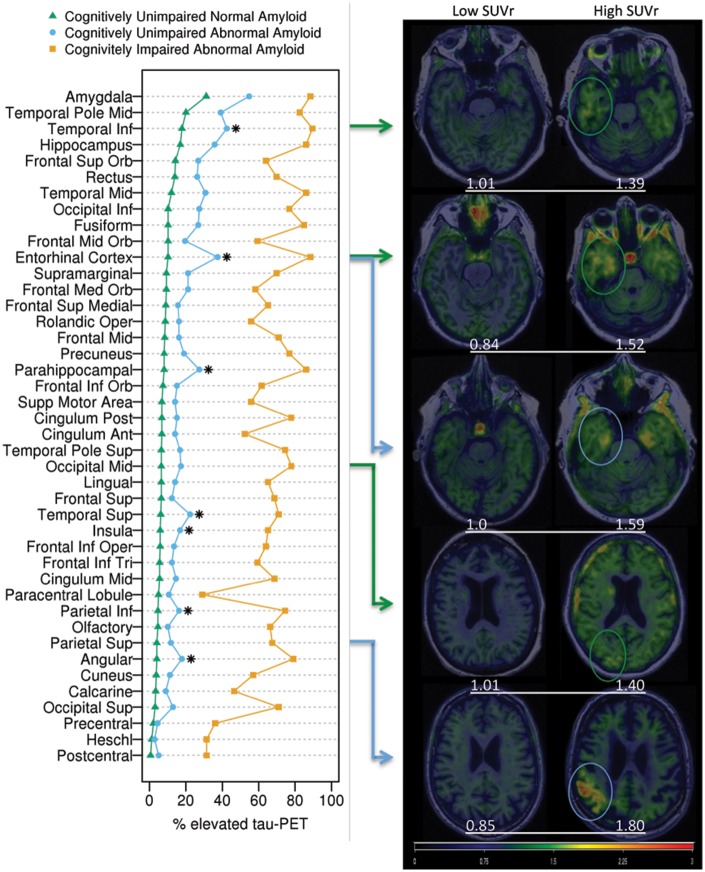
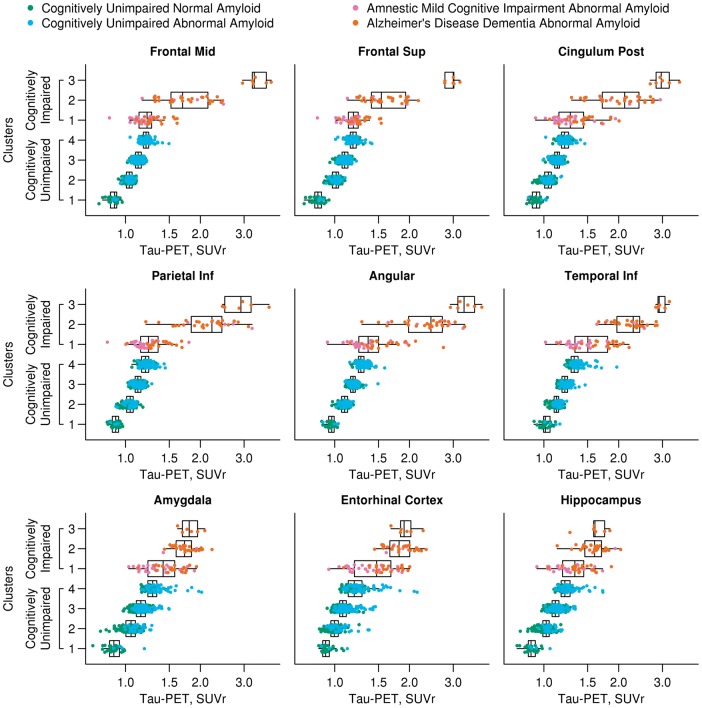
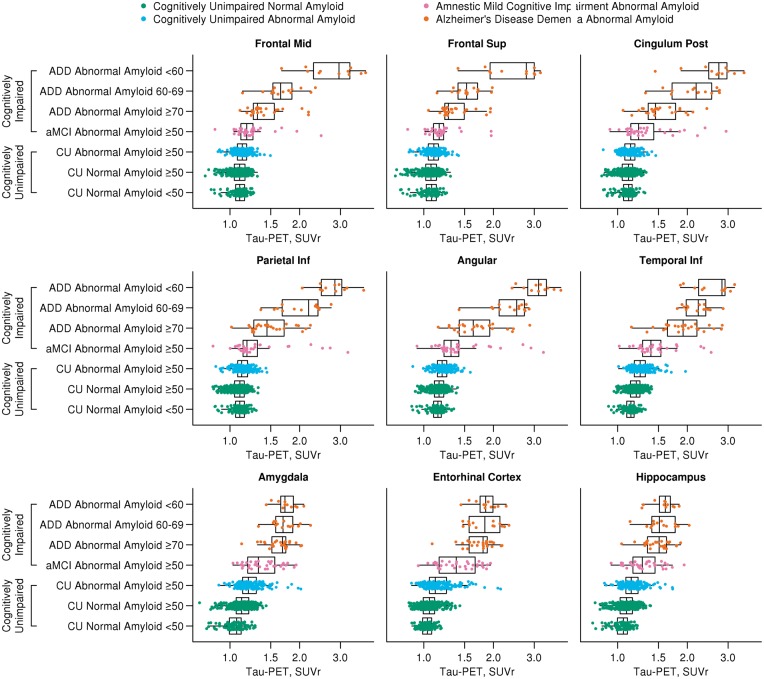
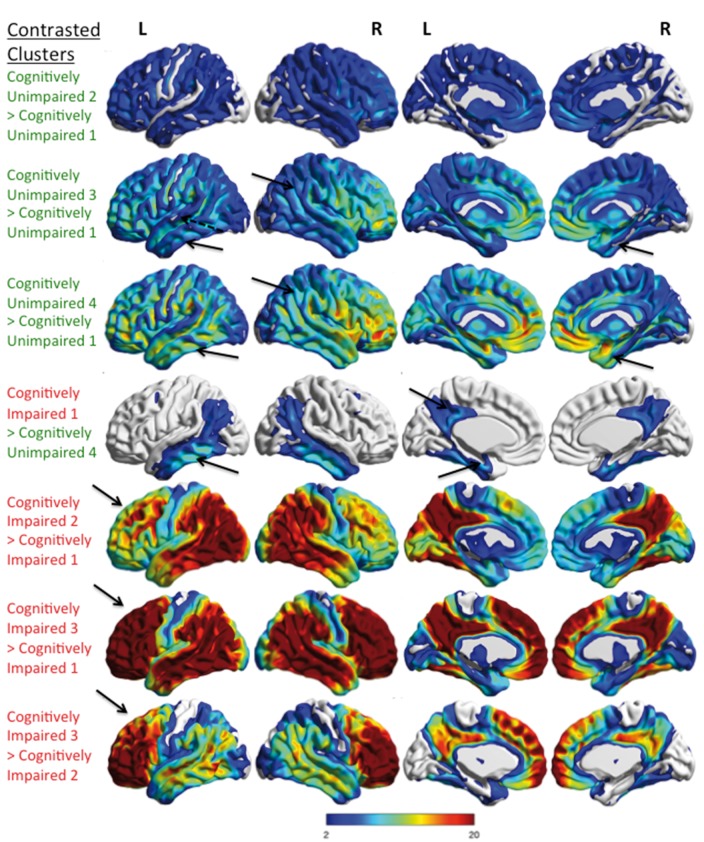
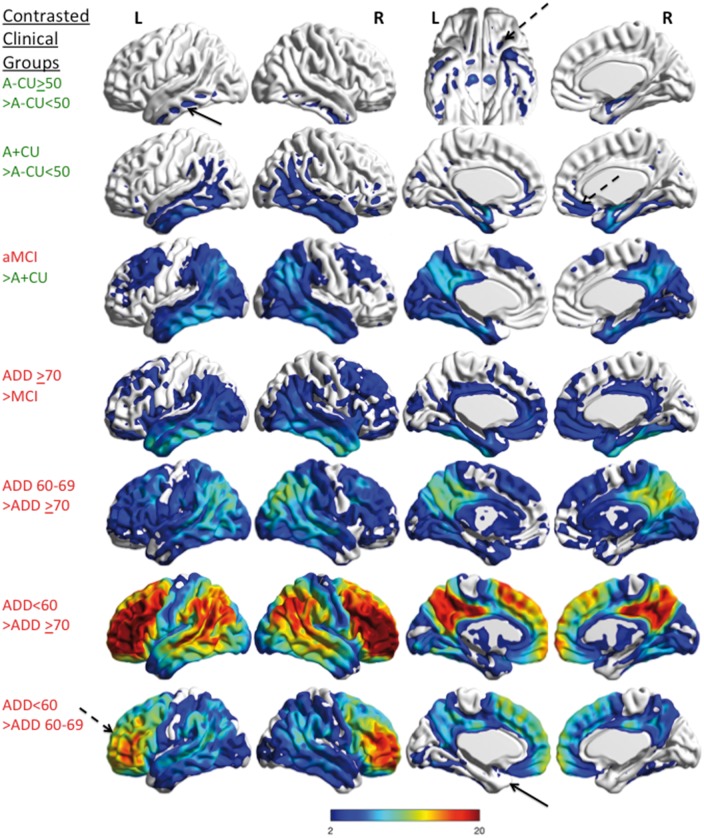
See Herholz (doi:10.1093/brain/awx340) for a scientific commentary on this article.Autopsy data have proposed that a topographical pattern of tauopathy occurs in the brain with the development of dementia due to Alzheimer's disease. We evaluated the findings of tau-PET to better understand neurofibrillary tangle development as it is seen in cognitively unimpaired and impaired individuals. The evolution of Alzheimer's disease tauopathy in cognitively unimpaired individuals needs to be examined to better understand disease pathogenesis. Tau-PET was performed in 86 cognitively impaired individuals who all had abnormal amyloid levels and 601 cognitively unimpaired individuals. Tau-PET findings were assessed for relationships with clinical diagnosis, age, and regional uptake patterns relative to Braak stage. Regional and voxel-wise analyses were performed. Topographical findings from tau-PET were characterized using hierarchical clustering and clinical characteristic-based subcategorization. In older cognitively unimpaired individuals (≥50 years), widespread, age-related elevated tau signal was seen among those with normal or abnormal amyloid status as compared to younger cognitively unimpaired individuals (30-49 years). More frequent regional tau signal elevation throughout the brain was seen in cognitively unimpaired individuals with abnormal versus normal amyloid. Elevated tau signal was seen in regions that are considered high Braak Stage in cognitively unimpaired and cognitively impaired individuals. Hierarchical clustering and clinical characteristic-based categorizations both showed different patterns of tau signal between groups such as greater tau signal in frontal regions in younger onset Alzheimer's disease dementia participants (most of whom had a dysexecutive clinical presentation). Tau-PET signal increases modestly with age throughout the brain in cognitively unimpaired individuals and elevated tau is seen more often when amyloid brain accumulation is present. Tau signal patterns in cognitively unimpaired correspond to early Braak stage but also suggest tangle involvement in extra-medial temporal and extra-temporal regions that are considered more advanced in the Braak scheme even when amyloid negative. Our findings also suggest the possibility of widespread development of early tangle pathology rather than a pattern defined exclusively by adjacent, region-to-region spread, prior to onset of clinical symptoms. Distinct patterns of neurofibrillary tangle deposition in younger-onset Alzheimer's disease dementia versus older-onset Alzheimer's disease dementia provide evidence for variability in regional tangle deposition patterns and demonstrate that different disease phenotypes have different patterns of tauopathy. Pathological correlation with imaging is needed to assess the implications of these observations.

Keywords: Alzheimer’s disease; amyloid-PET; dementia; mild cognitive impairment; tau-PET.


Figures

Figure 1
Figure 1
Tau-PET associations with age by region and clinical group. Spearman rank correlation coefficients for the association between regional tau-PET SUVr (without PVC) and age are shown among all cognitively unimpaired individuals in A with (light red) and without (dark red) adjusting for amyloid-PET SUVr. Correlations of tau-PET SUVr and age are shown within normal amyloid cognitively unimpaired, abnormal amyloid cognitively unimpaired, and abnormal amyloid cognitively impaired individuals in BD for tau-PET values with (lighter colours) and without (darker colours) PVC. Age was significantly correlated with tau-PET among all cognitively unimpaired in 34 of 47 regions without adjusting for amyloid-PET SUVr and in 12 of 47 regions after adjusting for amyloid-PET. Age was significantly correlated with tau-PET without PVC in 20/47 regions among normal amyloid cognitively unimpaired, in 10/47 regions among abnormal amyloid cognitively unimpaired, and in 38/47 regions among abnormal amyloid cognitively impaired. Tau-PET with PVC was associated with age in most regions. Permutation tests were used to correct P-values and confidence intervals for multiple comparisons across regions.
Figure 2
Figure 2
Percentage of individuals with elevated tau-PET signal in each region with image examples. The plot on the left shows the percentages of individuals with abnormal tau-PET signal by region within normal amyloid cognitively unimpaired (green), abnormal amyloid, cognitively unimpaired (blue), and abnormal amyloid cognitively impaired (orange) groups. Asterisks indicate regions where the proportion of individuals with elevated tau-PET was significantly greater among abnormal amyloid versus normal amyloid cognitively unimpaired after adjusting for age and correcting for multiple comparisons. Abnormal amyloid cognitively impaired individuals had the higher percentage of elevated tau-PET in all regions. Transaxial tau-PET images shown on the right show low and high SUVr ranges for normal amyloid (green arrows and circles) and abnormal amyloid (blue arrows and circles), cognitively unimpaired participants from selected regions (arrows show the regions that correlate with the images). Three temporal and two extra-temporal regions are shown. SUVr values (white text) are shown below each image. All images are normalized to the same colour scale.
Figure 3
Figure 3
Box plots of regional tau-PET SUVr by hierarchical clusters. Box plots of tau-PET SUVr for nine regions of interest by the four clusters among cognitively unimpaired individuals and three clusters among cognitively impaired individuals. Clinical diagnosis and amyloid-PET status is represented by different colours: normal amyloid cognitively unimpaired, green; abnormal amyloid cognitively unimpaired, blue; abnormal amyloid amnestic MCI (aMCI), purple; abnormal amyloid ADD, orange. The cognitively unimpaired groups have a gradually increasing tau-PET signal in all cortical regions. Greater tau-PET signal is seen in temporal and extra-temporal cortical regions (frontal, posterior cingulate, parietal, angular and temporal inferior) in the cognitively impaired cluster 3 compared to cluster 2 but similar tau-PET signal in the entorhinal cortex was seen in these two groups. Those in the cognitively impaired cluster 1 are more similar to the cognitively unimpaired cluster 4 than the other cognitively impaired clusters. Formal tests of differences in tau-PET among the clusters were not performed since the clusters were defined by tau-PET.
Figure 4
Figure 4
Box plots of regional tau-PET SUVr by age, amyloid-PET status and diagnosis subcategorization. Box plots of tau-PET SUVr for nine regions of interest by clinical diagnosis, amyloid-PET status, and age. Clinical diagnosis and amyloid-PET status are represented with different colours: normal amyloid cognitively unimpaired, green; abnormal amyloid cognitively unimpaired, blue; abnormal amyloid amnestic MCI (aMCI), purple; abnormal amyloid ADD, orange. Tau-PET SUVr differed significantly (P < 0.01), after adjusting for multiple comparisons, among the three cognitively unimpaired groups and among the four cognitively impaired groups for all nine regions shown in the figure. There is greater tau signal in the medial and extra medial temporal regions (inferior temporal for example; other regions seen on Supplementary Fig. 7) than in the cognitively unimpaired >50 normal amyloid group versus the cognitively unimpaired normal amyloid <50 group. The box plots also show a similar pattern of increased tau-PET signal in younger age ADD as compared to the cluster analysis with much higher extra-temporal tau-PET signal. However, there are participants in the younger age ADD group with tau-PET signal similar to the older age ADD group.
Figure 5
Figure 5
Comparison of the differences in tau-PET signal between hierarchical clusters. Voxel-wise tau-PET findings that are greater between pairs of hierarchical clusters are shown. The upper three rows show the comparisons of cognitively unimpaired clusters (green text). The lower four rows show cognitively impaired cluster comparisons (red text). There is greater tau-PET signal diffusely in cognitively unimpaired 2 versus cognitively unimpaired 1 clusters. Greater tau-PET signal is seen in cognitively unimpaired 3 and cognitively unimpaired 4 versus cognitively unimpaired 1 in the whole temporal and parietal lobes (arrows). Frontal accumulation is incrementally greater also. The incremental tau-PET signal seen between the different cognitively unimpaired clusters involves many regions of the brain outside of the temporal lobe. The magnitude of the increased tau-PET signal in the cognitively impaired clusters is greatest in the frontal lobes and is similar to the findings in Fig. 3. The cognitively impaired cluster 1 shows increased inferior temporal, medial temporal and posterior cingulate tau-PET signal (arrows) as compared to cognitively unimpaired cluster 4. Greater tau-PET signal in cognitively impaired 2 versus cognitively impaired 1 is seen in the temporal, parietal and posterior cingulate regions and less so in the frontal lobe (arrow). Cognitively impaired cluster 3 showed greater tau-PET signal in the frontal, temporal, parietal, posterior cingulate and angular regions than cognitively impaired 1 or cognitively impaired 2 clusters with pronounced increase in the frontal lobe versus cognitively impaired cluster 1 (arrows). All results were family-wise error (FWE) corrected, P < 0.05 and the colour bar shows the T-statistic range for all contrasts but is descriptive as the clustering was defined by using tau-PET SUVr.
Figure 6
Figure 6
Comparison of the differences in tau-PET signal between clinically characterized groups. Voxel-wise tau-PET findings that are greater between pairs of the clinically characterized groups are shown. The upper two rows show the comparisons of cognitively unimpaired groups by age and amyloid status (green text). The lower five rows show comparisons of cognitively impaired groups by diagnosis comparisons (red text). There is greater tau-PET signal in the inferior temporal lobes (black arrow) (in additional to medial temporal lobes) and frontal orbital regions (dashed arrow, shown on inferior view) in the cognitively unimpaired >50 normal amyloid group versus the cognitively unimpaired normal amyloid <50 group. Greater tau-PET signal is seen in the temporal, parietal and the frontal lobes (dashed arrow) in the cognitively unimpaired abnormal amyloid group versus the cognitively unimpaired normal amyloid <50 group. The amnestic MCI group shows increased temporal, parietal, posterior cingulate, and frontal tau-PET signal as compared to the cognitively unimpaired abnormal amyloid group and a similar pattern is also seen in ADD ≥70 versus amnestic MCI. This pattern is seen in ADD 60–69 versus ADD70 but is more diffuse. When the ADD <60 is contrasted to the other ADD groups, incremental frontal tau-PET signal is prominent (dashed arrow) but medial temporal differences are relatively small (arrow). All results were few corrected, P < 0.05 and the colour bar shows the T-statistic range for all contrasts. A = amyloid; aMCI = amnestic MCI; CU = cognitively unimpaired.

Comment in

References

    1. American Psychiatric Association. Diagnostic and statistical manual of mental disorders. 4th edn., text revision Washington, DC: American Psychiatric Association; 2000.
    1. Arriagada PV, Marzloff K, Hyman BT. Distribution of Alzheimer-type pathologic changes in nondemented elderly individuals matches the pattern in Alzheimer's disease. Neurology 1992; 42: 1681–8. - PubMed
    1. Ashburner J, Friston KJ. Unified segmentation. Neuroimage 2005; 26: 839–51. - PubMed
    1. Avants BB, Epstein CL, Grossman M, Gee JC. Symmetric diffeomorphic image registration with cross-correlation: evaluating automated labeling of elderly and neurodegenerative brain. Med Image Anal 2008; 12: 26–41. - PMC - PubMed
    1. Bennett DA, Schneider JA, Wilson RS, Bienias JL, Arnold SE. Neurofibrillary tangles mediate the association of amyloid load with clinical Alzheimer disease and level of cognitive function. Arch Neurol 2004; 61: 378–84. - PubMed

Publication types

MeSH terms