. 2017 Oct 6;8(58):98553-98566.
doi: 10.18632/oncotarget.21636. eCollection 2017 Nov 17.

Irisin treatment improves healing of dystrophic skeletal muscle

Affiliations

Irisin treatment improves healing of dystrophic skeletal muscle

Musarrat Maisha Reza et al. Oncotarget. .

Abstract

Background: Irisin is an exercise induced myokine that is shown to promote browning of adipose tissue and hence, increase energy expenditure. Furthermore, our unpublished results indicate that Irisin improves myogenic differentiation and induces skeletal muscle hypertrophy. Since exercise induced skeletal muscle hypertrophy improves muscle strength, we wanted to investigate if ectopic injection of Irisin peptide improves skeletal muscle function in a mouse model of muscular dystrophy. This utility of Irisin peptide is yet to be studied in animal models.

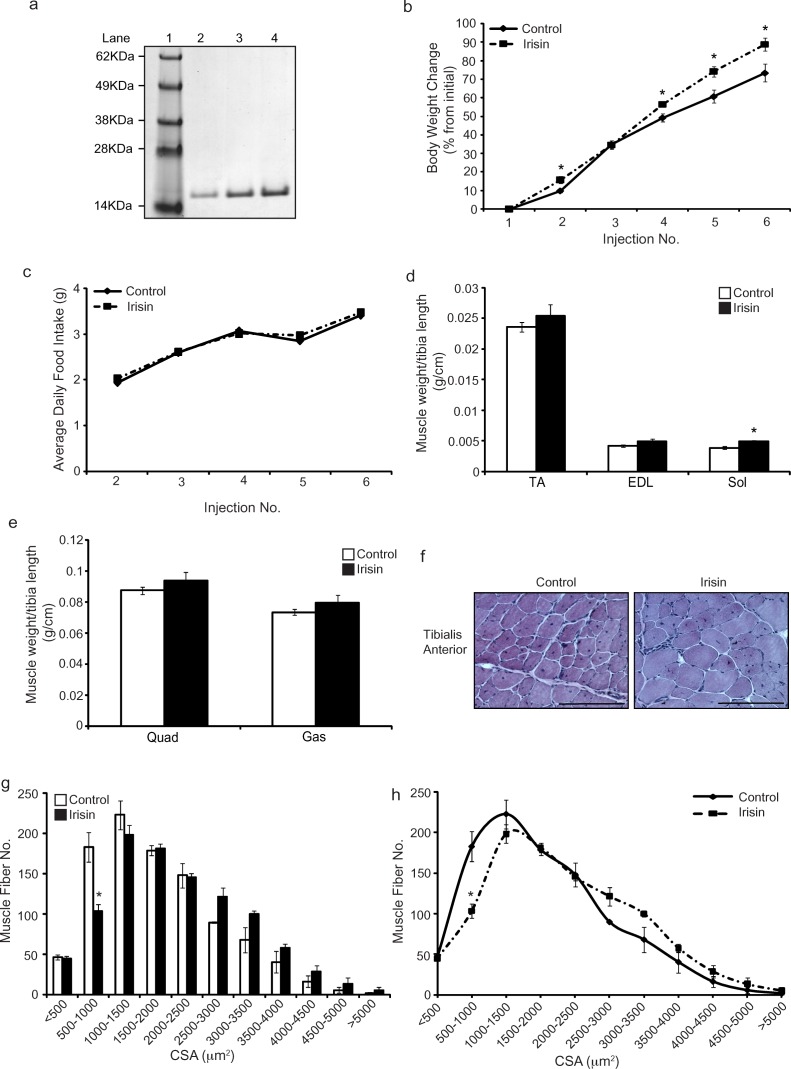
Methods: In order to test this hypothesis, we expressed and purified recombinant murine Irisin peptide from E. coli. Three- to six-week-old male mdx mice were injected IP with either vehicle (dialysis buffer) or Irisin recombinant peptide for two or four weeks, three times-a-week.

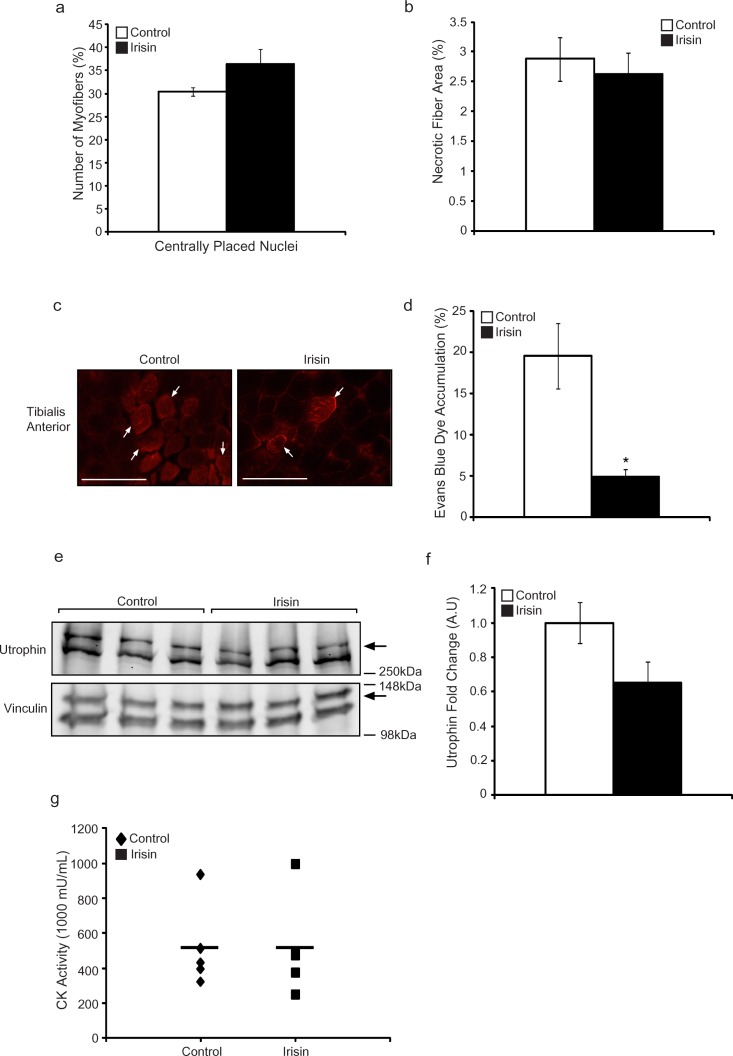
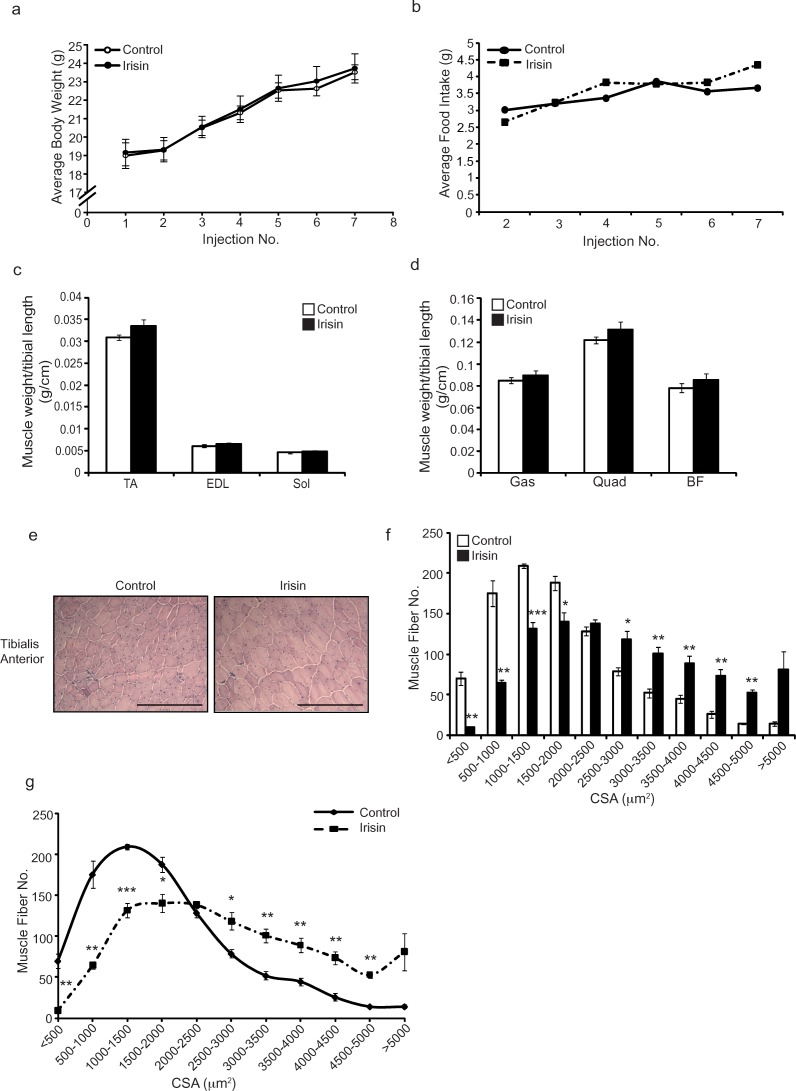
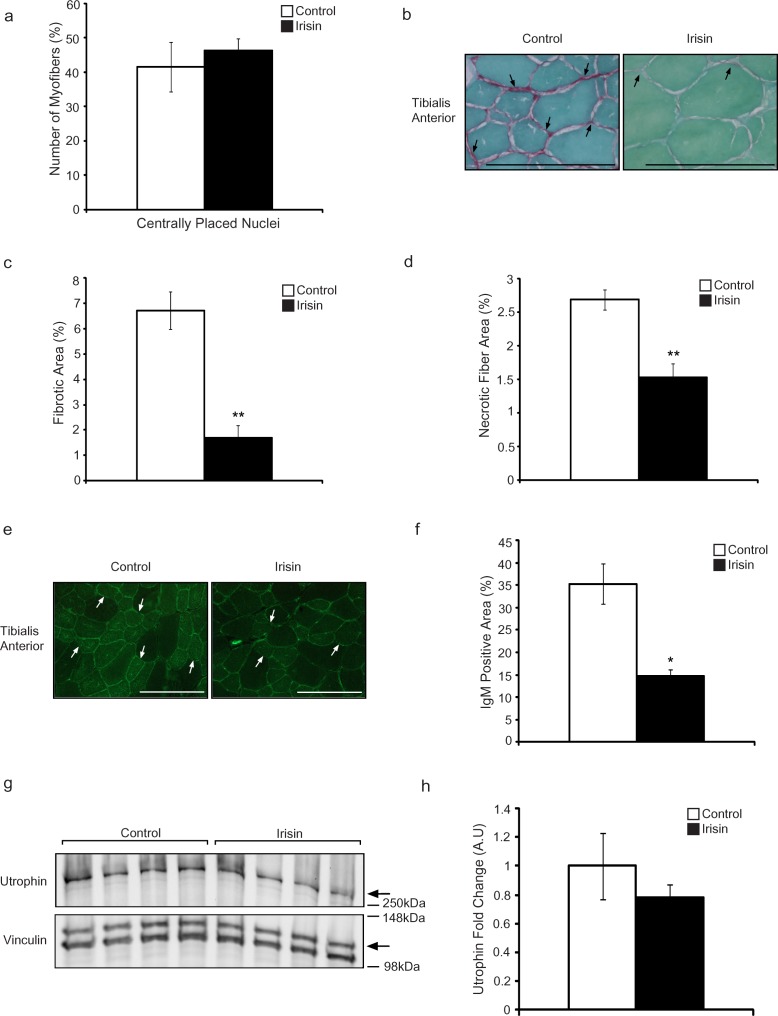
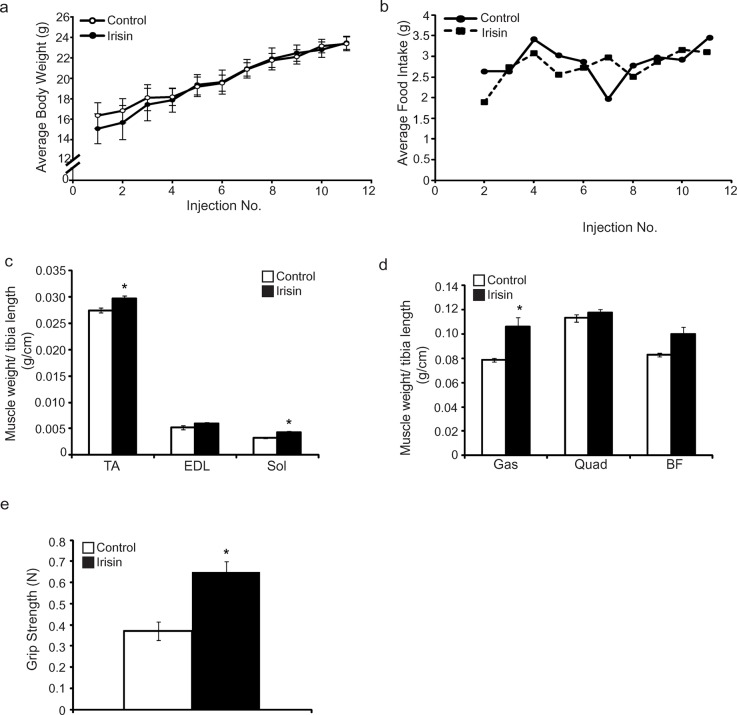
Results: Irisin injection increased muscle weights and enhanced grip strength in mdx mice. Improved muscle strength can be attributed to the significant hypertrophy observed in the Irisin injected mdx mice. Moreover, Irisin treatment resulted in reduced accumulation of fibrotic tissue and myofiber necrosis in mdx mice. In addition, Irisin improved sarcolemmal stability, which is severely compromised in mdx mice.

Conclusion: Irisin injection induced skeletal muscle hypertrophy, improved muscle strength and reduced necrosis and fibrotic tissue in a murine dystrophy model. These results demonstrate the potential therapeutic value of Irisin in muscular dystrophy.

Keywords: FNDC5; dystrophy; irisin; sarcolemmal stability; skeletal muscle.


Conflict of interest statement

CONFLICTS OF INTEREST Musarrat Maisha Reza, Chu Ming Sim, Nathiya Subramaniyam, Xiaojia Ge, Mridula Sharma, Ravi Kambadur and Craig McFarlane declare that they have no conflict of interest.

Figures

Figure 1
Figure 1. Irisin injection increases skeletal muscle mass and promotes hypertrophy in young mdx mice
(a) Representative image of Coomassie stained protein gel displaying purified recombinant His-tagged Irisin protein. A single band at ~15kDa was detected for recombinant Irisin protein. Lane 1 shows the SeeBlue Plus 2 Pre-Stained ladder. Lanes 2, 3 and 4 show 1μg, 2μg and 3μg of the purified His-tagged Irisin protein, respectively. (b) Graph showing percentage change in body weight of young (3-week-old) male mdx mice injected three times-a-week with either DB or Irisin (2.5μg/gram body weight) for two weeks. Body weights were measured prior to each injection. (c) Graph showing average daily food intake per mouse. Food intake was measured prior to each injection over the two-week trial. (d) Graph showing the average weight of TA, EDL and Sol skeletal muscle tissues, normalized to tibia length (g/cm), from young mdx mice injected with either DB or Irisin for two weeks. (e) Graph showing the average weight of Quad and Gas skeletal muscle tissues, normalized to tibia length (g/cm), from young mdx mice injected with either DB or Irisin for two weeks (n=5 mice per group for all experiments above). (f) Representative images of Haematoxylin and Eosin (H&E) stained TA muscle cross sections obtained from young mdx mice injected with either DB or Irisin for two weeks. Images were captured using a 20x objective. Scale bar represents 100μm. (g-h) Graphs showing the distribution of TA myofiber CSA from young mdx mice injected with either DB or Irisin for two weeks. (n=3 mice per group). Error bars represent mean ± SEM. For all relevant figures, the appropriate statistical analysis was performed and significance is indicated with * (P<0.05).
Figure 2
Figure 2. Irisin injection protects young mdx mice from dystrophic-associated skeletal muscle degeneration
(a) Graph showing the percentage of myofibers with centrally placed nuclei in TA muscle from young mdx mice injected with either DB or Irisin for two weeks. (b) Graph showing the percentage of necrotic fiber area in TA muscle from young mdx mice injected with either DB or Irisin for two weeks. (c) Representative images of Evans blue dye (EBD) stained TA muscle cross sections obtained from young mdx mice injected with either DB or Irisin for two weeks. White arrows indicate a selection of representative EBD positive myofibers. EBD positive myofibers were visualized using fluorescent microscopy under a 20x objective. Scale bar represents 100μm. Linear brightness and contrast of images was adjusted to visualize EBD positive myofibers without altering the interpretation of results in any way. (d) Graph showing the percentage of EBD incorporation in TA muscle of young mdx mice injected with either DB or Irisin for two weeks. (e) Western Blot analysis of Utrophin protein levels in Gas muscle isolated from young mdx mice injected with either DB or Irisin for two weeks. The levels of Vinculin were assessed as a loading control. (f) Graph showing densitometric analysis of Utrophin protein levels in arbitrary units (A.U), normalized to Vinculin (n=3 mice for all figures above). (g) Graph representing creatine kinase activity in serum of young mdx mice injected with DB or Irisin (n=5 mice for both groups). Error bars represent ± SEM. For all relevant figures, the appropriate statistical analysis was performed and significance is indicated with * (P<0.05).
Figure 3
Figure 3. Irisin injection enhances muscle weights and promotes skeletal muscle hypertrophy in adult mdx mice
(a) Graph showing average body weights of adult (6-week-old) male mdx mice injected three times-a-week with either DB or Irisin (2.5μg/gram body weight) for two weeks. Body weights were measured prior to each injection. (b) Graph showing average daily food intake per mouse. Food intake was measured prior to each injection over the two-week trial. (c) Graph showing the average weight of TA, EDL and Sol skeletal muscle tissues, normalized to tibia length (g/cm), from adult mdx mice injected with either DB or Irisin for two weeks. (d) Graph showing the average weight of Gas, Quad and BF skeletal muscle tissue, normalized to tibia length (g/cm), from adult mdx mice injected with either DB or Irisin for two weeks (n=6 mice per group for all experiments above). (e) Representative images of Haematoxylin and Eosin (H&E) stained TA muscle cross sections obtained from adult mdx mice injected with either DB or Irisin for two weeks. Images were captured using a 20x objective. Scale bar represents 100μm. (f-g) Graphs showing the distribution of TA myofiber CSA from adult mdx mice injected with either DB or Irisin for two weeks (n=4 mice per group for all experiments above). Error bars represent mean ± SEM. For all relevant figures, the appropriate statistical analysis was performed and significance is indicated with * (P<0.05), ** (P<0.01) and *** (P<0.001).
Figure 4
Figure 4. Irisin protects adult mdx mice from fibrotic tissue accumulation and muscle fiber degeneration
(a) Graph showing the percentage of myofibers with centrally placed nuclei in TA muscle from adult mdx mice injected with either DB or Irisin for two weeks (n=4 mice for both groups). (b) Representative images of Sirius red and Fast green stained TA muscle cross sections obtained from adult mdx mice injected with either DB or Irisin for two weeks. The green stain indicates non-collagenous proteins, while the red stain indicates collagen. Black arrows indicate a selection of representative fibrotic areas. Images were captured using a 40x objective. Scale bar represents 100μm. (c) Graph showing fibrotic area (red stain), expressed as a percentage of total muscle section area, in TA muscle from adult mdx mice injected with either DB or Irisin for two weeks, as assessed through Sirius red and Fast green staining. (d) Graph showing the percentage of necrotic fiber area in TA muscle from adult mdx mice injected with either DB or Irisin for two weeks (n=3 mice per group for all experiments above). (e) Representative images of IgM antibody stained TA muscle sections obtained from adult mdx mice injected with either DB or Irisin for two weeks. White arrows indicate a selection of representative IgM positive myofibers. Images were captured using a 20x objective. Scale bar represents 100μm. Linear brightness and contrast of images was adjusted to visualize IgM positive myofibers without altering the interpretation of results in any way. (f) Graph showing IgM stained area, expressed as a percentage of total muscle section area, in TA muscle sections from adult mdx mice injected with either DB or Irisin for two weeks. (g) Western Blot analysis of Utrophin protein levels in Gas muscle isolated from adult mdx mice injected with either DB or Irisin for two weeks. The levels of Vinculin were assessed as a loading control. (h) Graph showing densitometric analysis of Utrophin protein levels in arbitrary units (A.U), normalized to Vinculin (n=4 mice per group for all experiments above). Error bars represent mean ± SEM. For all relevant figures, the appropriate statistical analysis was performed and significance is indicated with * (P<0.05) and ** (P<0.01).
Figure 5
Figure 5. Prolonged Irisin injection increases skeletal muscle mass and enhances muscle function in mdx mice
(a) Graph showing average body weight of 4-week-old male mdx mice injected three times-a-week with either DB or Irisin (2.5μg/gram body weight) for four weeks. Body weights were measured prior to each injection. (b) Graph showing average daily food intake per mouse. Food intake was measured prior to each injection over the four-week trial. (c) Graph showing the average weight of TA, EDL and Sol skeletal muscle tissues, normalized to tibia length (g/cm), from 4-week-old mdx mice injected with either DB or Irisin for four weeks. (d) Graph showing the average weight of Gas, Quad and BF skeletal muscle tissues, normalized to tibia length (g/cm), from 4-week-old mdx mice injected with either DB or Irisin for four weeks. (e) Graph showing the forelimb grip strength (N) of 4-week-old mdx mice injected with either DB or Irisin for four weeks. Grip strength was assessed prior to termination of the mice. (n=3 mice for the DB injected control group and n=4 mice for the Irisin injected group for all experiments above). Error bars represent mean ± SEM. For all relevant figures, the appropriate statistical analysis was performed and significance was indicated with * (P<0.05).

Similar articles

Cited by

References

    1. Sussman M. Duchenne muscular dystrophy. J Am Acad Orthop Surg. 2002;10:138–51. - PubMed
    1. Menezes MP, North KN. Inherited neuromuscular disorders: pathway to diagnosis. J Paediatr Child Health. 2012;48:458–65. http://doi.org/10.1111/j.1440-1754.2011.02210.x - DOI - PubMed
    1. Barton ER, Morris L, Musaro A, Rosenthal N, Sweeney HL. Muscle-specific expression of insulin-like growth factor I counters muscle decline in mdx mice. J Cell Biol. 2002;157:137–48. - PMC - PubMed
    1. Yiu EM, Kornberg AJ. Duchenne muscular dystrophy. Neurol India. 2008;56:236–47. - PubMed
    1. Hoffman EP, Monaco AP, Feener CC, Kunkel LM. Conservation of the Duchenne muscular dystrophy gene in mice and humans. Science. 1987;238:347–50. - PubMed