. 2017 Oct 23;8(58):98782-98797.
doi: 10.18632/oncotarget.21961. eCollection 2017 Nov 17.

Prohibitin-mediated mitochondrial ubiquitination during spermiogenesis in Chinese mitten crab Eriocheir sinensis

Affiliations

Prohibitin-mediated mitochondrial ubiquitination during spermiogenesis in Chinese mitten crab Eriocheir sinensis

Cong-Cong Hou et al. Oncotarget. .

Abstract

The sperm of Eriocheir sinensis has a cup-shaped nucleus that contains several mitochondria embedded at the opening of the cup. The acrosome vesicle also contains derivants of mitochondria. The mitochondria distribution pattern involves a decrease in the number and changes in the structure and transportation of these organelles. The decreased number of sperm mitochondria is achieved through autophagy or the ubiquitination pathway. Prohibitin (PHB), the mitochondria inner membrane protein, is an evolutionarily highly conserved protein, is closely associated with spermatogenesis and sperm quality control and is also a potential substrate of ubiquitination. However, whether PHB protein mediates the ubiquitination pathway of sperm mitochondria in crustacean animals remains poorly understood. In the present study, we revealed that PHB, a substrate of ubiquitin, participates in the ubiquitination and degradation of mitochondria during spermiogenesis in E. sinensis. To confirm this finding, we used shRNA interference to reduce PHB expression and an overexpression technique to increase PHB expression in vitro. The interference experiment showed that the reduced PHB expression directly affected the polyubiquitination level and mitochondria status, whereas PHB overexpression markedly increased the polyubiquitination level. In vitro experiments also showed that PHB and its ubiquitination decide the fate of mitochondria.

Keywords: Eriocheir sinensis; crustacean; mitochondria; prohibitin; ubiquitination.


Conflict of interest statement

CONFLICTS OF INTEREST The authors confirm that this article has no conflicts of interest.

Figures
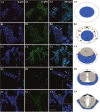
Figure 1
Figure 1. FISH of phb gene expression during the spermiogenesis of the Chinese mitten crab E. sinensis
The phb mRNA primarily located in or around nucleus (arrows). In the round or elliptical spermatocytes, the phb mRNA signal in both the nucleus and cytoplasm (A3-A4, arrows). In round or elliptical spermatids, the phb mRNA signal was weakly distributed in the nucleus (B3-B4, arrows). In middle-stage spermatids, the nucleus becomes cup-like. The phb mRNA signals were distributed in the cup-like nucleus and gathered to one side in the cytoplasm. Notably, the signals increased in the cytoplasm than in the round or elliptical spermatids (C3-C4, arrows). Both in late-stage spermatids and mature sperm, the signal intensity sharply declined, and the sporadic signal was distributed in the opening of the nucleus cup, where the mitochondria were concentrated (D3-D4, E3-E4, arrows). Bar=20 μm.
Figure 2
Figure 2. Expression of PHB protein in different tissues of E. sinensis
The protein was separated using polyacrylamide gel electrophoresis (total protein content: 10μg), and the protein was transferred to nitrocellulose membranes. PHB polyclonal antibody was used to detect the tissue expression. β-actin was used as a control (A). The results showed that PHB was strongly expressed in all the tested tissues (B). T: testis, M: muscle, H: heart, AG: accessory gland.
Figure 3
Figure 3. Distribution comparison of mitochondria and PHB during spermiogenesis
Mitochondria and PHB were primarily distributed in the acrosome tube and acrosome cap. Bar=10 μm.
Figure 4
Figure 4. Co-localization of PHB and FK2 expression during spermiogenesis of E. sinensis
In the early and middle stages, PHB has a few signals surrounding the nucleus and concentrating on one side of the cytoplasm. The FK2 signal is concentrated in the cytoplasm and surrounded by crescent shaped nuclei, consistent with the distribution of PHB in the cytoplasm. The arrows represent early or middle spermatids in A2-A4. In the late stages of spermiogenesis, PHB signals are distributed around the cell membrane and in the acrosome cap. The FK2 signals are primarily concentrated in the acrosome cap. The arrows represent middle and late spermatids in B2-B4. In mature spermatozoa, the nuclei are typically cup-shaped, and the PHB signal is concentrated on the acrosome cap, but the PHB signals in this period are not as intense as in the middle stage. FK2 signals are enriched in acrosome cap and are highly consistent with PHB signal localization. The arrows represent mature sperm in C2-C4. The yellow part of the arrow in the Merged figure shows the co-localization of PHB and FK2. Bar=10 μm.
Figure 5
Figure 5. Co-localization of mitochondria and FK2 expression during spermiogenesis of E. sinensis
In early and middle stages of spermiogenesis, mitochondria are concentrated on one side of the cytoplasm, and FK2 signals are concentrated on the same side of spermatid, consistent with mitochondrial markers in the cytoplasm. In the middle and late stages of spermiogenesis, the signals of mitochondria were concentrated in acrosome cap and acrosome tube, and the signal in acrosome tube was stronger than that in acrosome cap. During this period, the FK2 signals were primarily concentrated in the acrosome cap, and there were also weak signals in the acrosome tube. In mature spermatozoa, the nucleus is typical cup-shaped, and the signals of mitochondria also primarily focus on the acrosome tube and acrosome cap, and the signal in the acrosome tube is stronger. The FK2 signal is also concentrated on the acrosome tube and acrosome cap, but the signal on the acrosome cap is stronger. Mitochondria were partially localized to the FK2 signals. Bar=10 μm.
Figure 6
Figure 6. Determination of PHB knockdown in MLTC1
(A) The expression of phb gene was detected after transient transfection with shRNA interference plasmid for 48 h. GAPDH was used as a positive control. GFP indicates the transfection effect of plasmid. (B) Analysis of relative expression of phb gene after transient transfection with shRNA interference plasmid for 48 h. The expression of phb in the shPHB138 group was approximately 66% of the blank vector group and blank control group. ShPHB305 interference efficiency was approximately 33%. The expression of phb in the control groups was significantly higher than that in the shPHB138 group. **P < 0.01.
Figure 7
Figure 7. PHB expression and distribution analysis after phb knockdown in MLTC-1 cells
The expression of PHB in cells treated with shPHB138 was significantly decreased and scattered. The yellow arrows indicate the expression of PHB in transfected cells, and the white arrows refer to the control cells. DAPI was used to label the nucleus, GFP was used to label the transfected cells, and the red signals indicate PHB protein. The last column showed PHB signal strength analysis using ImageJ. Bar=10 μm.
Figure 8
Figure 8. Mitochondrial state and distribution analysis after phb knockdown in MLTC-1 cells
In the nonsense control (shRFP) and the blank vector control groups, the mitochondria signals were strong and consistent in the transfected and untransfected cells. However, the mitochondria signals in the transfection group were weaker than those in the control groups. The DAPI was used to label the nucleus, GFP indicates the transfected cells, and the red signal is the mitochondrial signal. The last column showed PHB signal strength analysis by ImageJ. Bar=10 μm.
Figure 9
Figure 9. Ubiquitination level analysis after phb knockdown in MLTC-1 cells
After phb gene knockdown, FK2 signal is weak and not group-like aggregation (White Circle). In the interference group, FK2 accumulated in small groups in the untransfected cells (White Box); whereas in the nonsense control (shRFP) and blank vector groups, FK2 was expressed in transfected cells and untransfected cells. DAPI was used to label the nucleus, GFP labeled the transfected cells, and the red signal represents the FK2 signal. Bar=10 μm.
Figure 10
Figure 10. Determination of es-phb overexpression in MLTC1 cells
(A) The expression of phb and es-phb gene after transient transfection for 48 h. GAPDH is the positive control. pCMV was used to determine the effect of plasmid transfection. (B) Analysis of relative expression of es-phb gene after transient transfection for 48 h. The expression level of phb gene indicates the intracellular expression level of intracellular level. es-phb gene indicates overexpression gene expression. pCMV was detected as an indicator of transfection efficiency. pNEP: pCMV-N-Flag-es-phb, pNREP: pCMV-N-Flag-RFP-es-phb, pEEP: pCMV-EGFP-es-phb. ***P < 0.001.
Figure 11
Figure 11. Analysis of PHB expression, mitochondria state and ubiquitination level after es-phb overexpression in MLTC-1 cells
(A) The group transfected with the expression plasmid pCMV-N-Flag-RFP-es-phb. (B) The group transfected with the expression plasmid pCMV-EGFP-es-phb; (C) and (D) The control group. The expression level of PHB in overexpression group was higher than that in the control group (yellow arrows). In the overexpression group, FK2 was clustered into large clumps (white arrows), while FK2 in the control group was clustered into small agglomerates (white arrow heads), indicating that PHB overexpression increased the poly-ubiquitin level. Bar=10 μm.

Similar articles

Cited by

References

    1. Hou CC, Yang WX. Characterization and expression pattern of p53 during spermatogenesis in the Chinese mitten crab Eriocheir sinensis. Mol Biol Rep. 2013;40:1043–1051. - PubMed
    1. Wang YT, Mao H, Hou CC, Sun X, Wang DH, Zhou H, Yang WX. Characterization and expression pattern of KIFC1-like kinesin gene in the testis of the Macrobrachium nipponense with discussion of its relationship with structure lamellar complex (LCx) and acroframosome (AFS) Mol Biol Rep. 2012;39:7591–7598. - PubMed
    1. Hou CC, Yang WX. Acroframosome-dependent KIFC1 facilitates acrosome formation during spermatogenesis in the caridean shrimp Exopalaemon modestus. PLoS One. 2013;8:e76065. - PMC - PubMed
    1. Fawcett DW. The mammalian spermatozoon. Dev Biol. 1975;44:394–436. - PubMed
    1. Meinhardt A, Wilhelm B, Seitz J. Expression of mitochondrial marker proteins during spermatogenesis. Hum Reprod Update. 1999;5:108–119. - PubMed

LinkOut - more resources