. 2017 Dec 11;5(1):158.
doi: 10.1186/s40168-017-0377-0.

Impact of prematurity and nutrition on the developing gut microbiome and preterm infant growth

Affiliations

Impact of prematurity and nutrition on the developing gut microbiome and preterm infant growth

Alex Grier et al. Microbiome. .

Abstract

Background: Identification of factors that influence the neonatal gut microbiome is urgently needed to guide clinical practices that support growth of healthy preterm infants. Here, we examined the influence of nutrition and common practices on the gut microbiota and growth in a cohort of preterm infants.

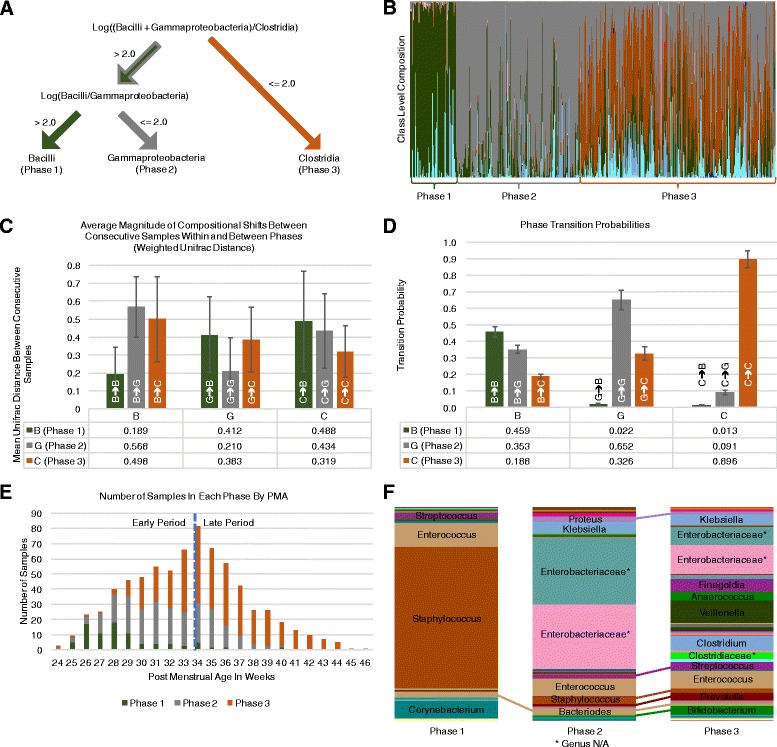
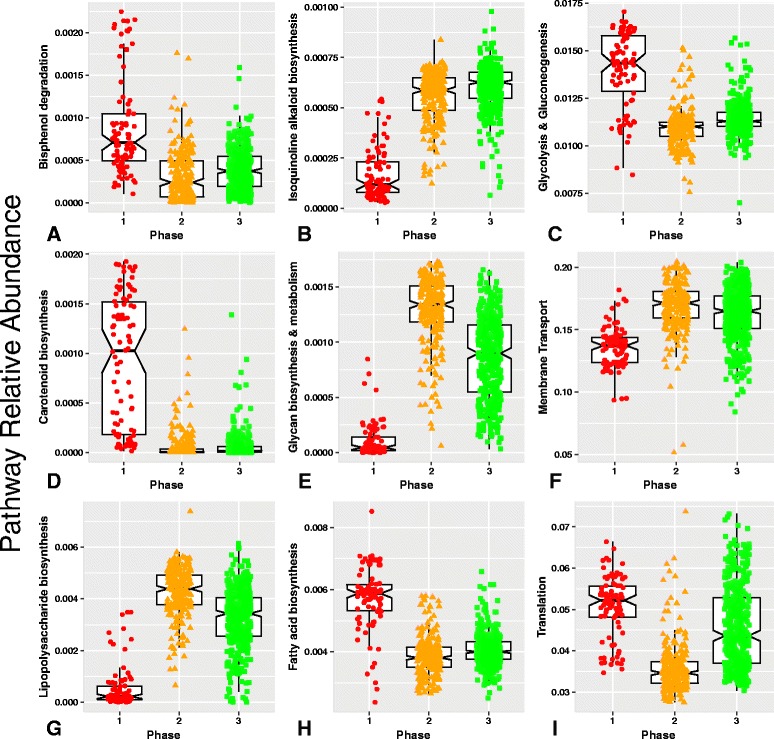
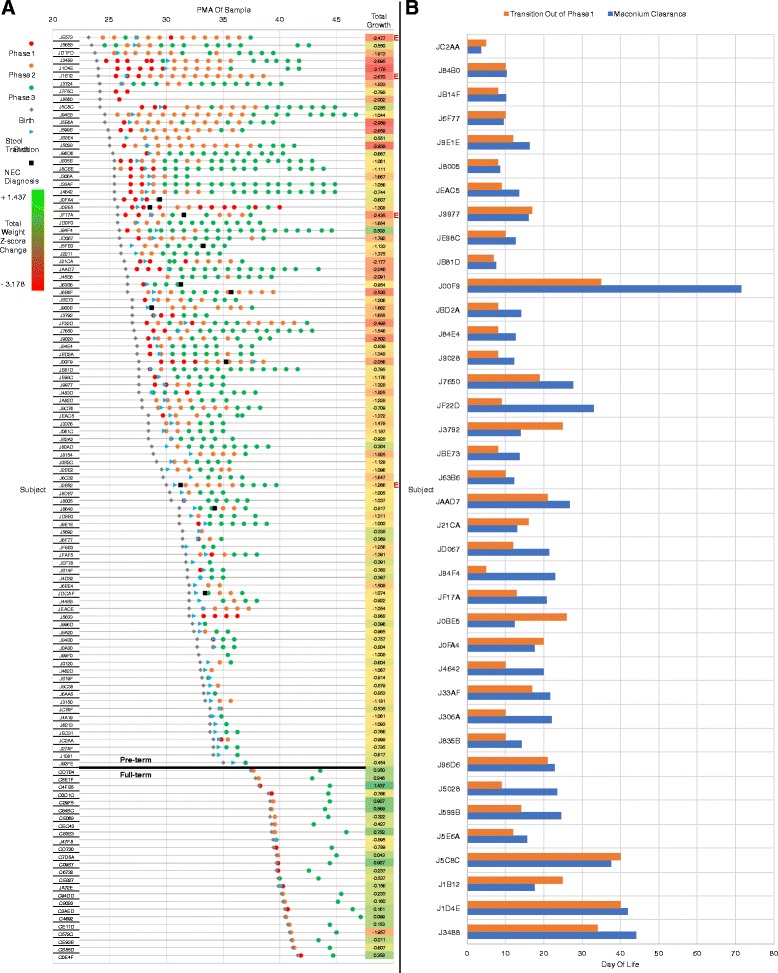
Results: With weekly gut microbiota samples spanning postmenstrual age (PMA) 24 to 46 weeks, we developed two models to test associations between the microbiota, nutrition and growth: a categorical model with three successive microbiota phases (P1, P2, and P3) and a model with two periods (early and late PMA) defined by microbiota composition and PMA, respectively. The more significant associations with phase led us to use a phase-based framework for the majority of our analyses. Phase transitions were characterized by rapid shifts in the microbiota, with transition out of P1 occurring nearly simultaneously with the change from meconium to normal stool. The rate of phase progression was positively associated with gestational age at birth, and delayed transition to a P3 microbiota was associated with growth failure. We found distinct bacterial metabolic functions in P1-3 and significant associations between nutrition, microbiota phase, and infant growth.

Conclusion: The phase-dependent impact of nutrition on infant growth along with phase-specific metabolic functions suggests a pioneering potential for improving growth outcomes by tailoring nutrient intake to microbiota phase.

Keywords: Gut microbiota; Infant growth; Meconium; Nutrition; Phase transition; Preterm infants.


Conflict of interest statement

Ethics approval and consent to participate

Written informed consent was obtained from a parent or guardian of all participating infants. The institutional review board at the University of Rochester School of Medicine and Strong Memorial Hospital approved the study.

Consent for publication

Not applicable.

Competing interests

The authors declare that they have no competing interests.

Publisher’s Note

Springer Nature remains neutral with regard to jurisdictional claims in published maps and institutional affiliations.

Figures

Fig. 1
Fig. 1
Overview of the preterm infant gut microbiota phases and properties. a The decision tree for classifying a microbiota sample into one of the three phases. b A composition bar chart with each sample grouped by phases 1–3 (P1–P3) from left to right. Green, gray, orange, and blue represent Bacilli, Gammaproteobacteria, Clostridia, and Bacteroidia, respectively. c Bar charts representing the average weighted UniFrac distance between consecutive samples of each individual infant. The bars are grouped into three major categories from left to right according to the initial phase of the consecutive samples being assessed. Each bar within a category corresponds to the phase of the second consecutive sample. The height of the bar indicates the average dissimilarity between consecutive samples of the corresponding phases, with exact values included in the table below the graph. d Bar charts indicating the transition probability between consecutive samples within an individual. The groupings and bars within each group indicate the phases of the first and second sample of a pair of consecutive samples, respectively, and are ordered as described in c. Transition probabilities are included in the table below the graph. e The distribution of samples over corrected gestational age in weeks. The dashed line separates the samples into early (< 34 weeks PMA) and late period (≥ 34 weeks PMA), based on functional variance of microbiota composition across all 81 individuals. f Bar charts showing the average composition of the samples in each phase at the genus level, with prominent genera labeled. For two Enterobacteriacaea and one Clostridiacaeae, the genus could not be determined and the family is indicated instead (See Additional file 2: Comment on Figure 3F). Lines connecting segments between phases indicate that the segment represents the same genus in each bar. A complete list of the genera represented here and their relative abundances can be found in Additional file 4: Table S3
Fig. 2
Fig. 2
ai Functional capacity of microbiota phases. The functional capacity of the microbiota present in each sample was inferred using PICRUSt (Phylogenetic Investigation of Communities by Reconstruction of Unobserved States) [63]. Each gray panel corresponds to one function and each point within a gray panel represents one sample. The samples are stratified by phase along the x axis, with red circles corresponding to P1, orange triangles corresponding to P2, and green squares corresponding to P3 samples. The sample position on the y axis indicates the relative abundance of the specified KEGG pathway, calculated as the fraction of times functional components of that pathway occurs across all organisms in the sample, with the contribution of each organism weighted by its relative abundance. Within each phase, samples are plotted on top of a box plot, which is centered on the median, with notches indicating an approximately 95% confidence interval, boxes indicating the boundaries of the first and third quartiles, and whiskers extending to the largest and smallest values no further than 1.5*(inter-quartile range) from the boxes. Points beyond the whiskers are outliers. If the notches of two boxes within the same gray panel do not overlap on the y axis, there is strong evidence that the true medians differ [69]. Functional pathways that are differentially enriched among the three phases include those that contribute to the degradation of phthalates on NICU medical devices (bisphenol degradation), protection against oxidative stress (carotenoid biosynthesis), microbiota driven increases in lipopolysaccharide (LPS) concentrations (lipopolysaccharide biosynthesis), short-chain fatty acids (fatty acid biosynthesis), isoquinoloine alkaloid biosynthesis, glycolysis and gluconeogenesis, glycan biosynthesis and metabolism, membrane transport and translation
Fig. 3
Fig. 3
Temporal distribution of gut microbiota phases, change in infant weight and meconium clearance. a All rectal samples from 95 preterm and 25 full-term infants are plotted against post menstrual age, stratified by subject and sorted by gestational age at birth. Samples for preterm infants include those collected weekly from birth through discharge. Samples for full-term infants include the first sample after birth (collected at ≤ 20 DOL) and a second sample, collected ≤ 50 DOL. Microbiota phases (P1, red circle; P2, orange circle; P3, green circle), birth (gray diamond), stool transition (blue arrowhead), and NEC diagnosis (black square) at discharge are also indicated. Change in weight Z-score from birth to discharge, and elemental feeding requirements (maroon E) at discharge for preterm infants are indicated in the right margin. The lowest to greatest change in weight Z-score from birth to discharge spans the spectrum from red to green. In all infants, except for J94F4, the total weight change in weight Z-score from birth to discharge was negative. Weight Z-score changes in full-term infants were both positive and negative, and negative changes tended to be smaller than those observed in preterms. b Day of life of stool transition and phase transition for 38 preterm subjects in phase one (P1) at the time of their first microbiota sample. The relationship between day of life (DOL) for the initial transition out of P1 and from meconium to normal infant stool was modeled by linear regression. These results demonstrate a highly significant association between the transition out of P1 and from meconium to normal infant stool that is independent of PMA or prematurity, suggesting that the P1 and meconium microbiota are closely associated

Similar articles

Cited by

References

    1. Cormack BE, Embleton ND, van Goudoever JB, Hay WW, Bloomfield FH. Comparing apples with apples: it is time for standardized reporting of neonatal nutrition and growth studies. Pediatr Res. 2016;79(6):810–820. doi: 10.1038/pr.2016.26. - DOI - PubMed
    1. Horbar JD, Ehrenkranz RA, Badger GJ, Edwards EM, Morrow KA, Soll RF, Buzas JS, Bertino E, Gagliardi L, Bellu R. Weight growth velocity and postnatal growth failure in infants 501 to 1500 grams: 2000–2013. Pediatrics. 2015;136(1):e84–e92. doi: 10.1542/peds.2015-0129. - DOI - PubMed
    1. Blanton LV, Charbonneau MR, Salih T, Barratt MJ, Venkatesh S, Ilkaveya O, Subramanian S, Manary MJ, Trehan I, Jorgensen JM, et al. MICROBIOME gut bacteria that prevent growth impairments transmitted by microbiota from malnourished children. Science. 2016;351(6275):830–U857. doi: 10.1126/science.aad3311. - DOI - PMC - PubMed
    1. Kostic AD, Gevers D, Siljander H, Vatanen T, Hyotylainen T, Hamalainen AM, Peet A, Tillmann V, Poho P, Mattila I, et al. The dynamics of the human infant gut microbiome in development and in progression toward type 1 diabetes. Cell Host Microbe. 2015;17(2):260–273. doi: 10.1016/j.chom.2015.01.001. - DOI - PMC - PubMed
    1. La Rosa PS, Warner BB, Zhou Y, Weinstock GM, Sodergren E, Hall-Moore CM, Stevens HJ, Bennett WE, Jr, Shaikh N, Linneman LA, et al. Patterned progression of bacterial populations in the premature infant gut. Proc Natl Acad Sci U S A. 2014;111(34):12522–12527. doi: 10.1073/pnas.1409497111. - DOI - PMC - PubMed

MeSH terms