

Correcting the predictive validity of a selection test for the effect of indirect range restriction
- PMID: 29228995
- PMCID: PMC5725878
- DOI: 10.1186/s12909-017-1070-5
Correcting the predictive validity of a selection test for the effect of indirect range restriction
Abstract
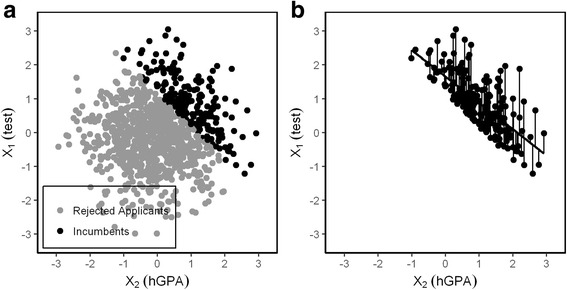
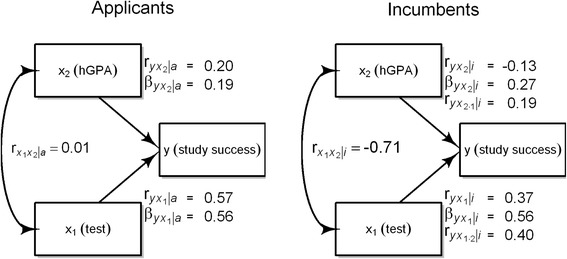
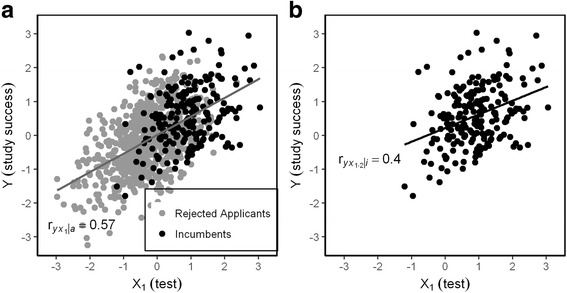
Background: The validity of selection tests is underestimated if it is determined by simply calculating the predictor-outcome correlation found in the admitted group. This correlation is usually attenuated by two factors: (1) the combination of selection variables which can compensate for each other and (2) range restriction in predictor and outcome due to the absence of outcome measures for rejected applicants.
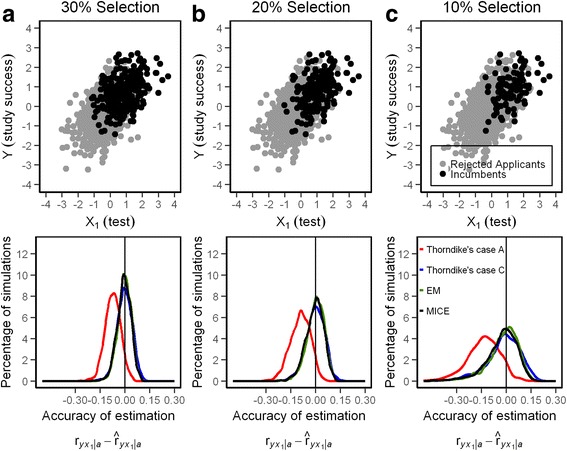
Methods: Here we demonstrate the logic of these artifacts in a situation typical for student selection tests and compare four different methods for their correction: two formulas for the correction of direct and indirect range restriction, expectation maximization algorithm (EM) and multiple imputation by chained equations (MICE). First we show with simulated data how a realistic estimation of predictive validity could be achieved; second we apply the same methods to empirical data from one medical school.
Results: The results of the four methods are very similar except for the direct range restriction formula which underestimated validity.
Conclusion: For practical purposes Thorndike's case C formula is a relatively straightforward solution to the range restriction problem, provided distributional assumptions are met. With EM and MICE more precision is obtained when distributional requirements are not met, but access to a sophisticated statistical package such as R is needed. The use of true score correlation has its own problems and does not seem to provide a better correction than other methods.
Keywords: EM; Mice; Predictive validity; Range restriction; Student selection; Suppression.
Conflict of interest statement
Ethics approval and consent to participate
The ethic commission board (Ethik-Kommission der Ärztekammer Hamburg, PV4983) has approved that our admission research in general does not constitute research with human subjects (“kein Forschungsvorhaben am Menschen”) in a clinical sense. The present study is part of a larger project that has been approved by the dean of the Hamburg medical faculty (statement of ethical considerations development of admission procedures at Hamburg Medical School). We obtained written informed consent from our participants.
Consent for publication
Not applicable
Competing interest
The authors declare that they have no competing interests.
Publisher’s Note
Springer Nature remains neutral with regard to jurisdictional claims in published maps and institutional affiliations.
Figures
Similar articles
-
Selection and academic success of medical students in Hamburg, Germany.BMC Med Educ. 2019 Jan 16;19(1):23. doi: 10.1186/s12909-018-1443-4. BMC Med Educ. 2019. PMID: 30651098 Free PMC article.
-
Construct-level predictive validity of educational attainment and intellectual aptitude tests in medical student selection: meta-regression of six UK longitudinal studies.BMC Med. 2013 Nov 14;11:243. doi: 10.1186/1741-7015-11-243. BMC Med. 2013. PMID: 24229353 Free PMC article.
-
A Missing Data Approach to Correct for Direct and Indirect Range Restrictions with a Dichotomous Criterion: A Simulation Study.PLoS One. 2016 Mar 28;11(3):e0152330. doi: 10.1371/journal.pone.0152330. eCollection 2016. PLoS One. 2016. PMID: 27019277 Free PMC article.
-
Uncertainties in the selection of applicants for medical school.Adv Health Sci Educ Theory Pract. 2007 Nov;12(4):509-21. doi: 10.1007/s10459-007-9076-0. Epub 2007 Aug 17. Adv Health Sci Educ Theory Pract. 2007. PMID: 17703368 Review.
-
Overview: what's worked and what hasn't as a guide towards predictive admissions tool development.Adv Health Sci Educ Theory Pract. 2009 Dec;14(5):759-75. doi: 10.1007/s10459-009-9160-8. Epub 2009 Apr 2. Adv Health Sci Educ Theory Pract. 2009. PMID: 19340597 Review.
Cited by
-
Who is allowed to study medicine? - regulations and evidence.GMS J Med Educ. 2019 Feb 15;36(1):Doc10. doi: 10.3205/zma001218. eCollection 2019. GMS J Med Educ. 2019. PMID: 30828610 Free PMC article. No abstract available.
-
Data Augmentation Enhances Plant-Genomic-Enabled Predictions.Genes (Basel). 2024 Feb 24;15(3):286. doi: 10.3390/genes15030286. Genes (Basel). 2024. PMID: 38540344 Free PMC article.
-
Does 'online confidence' predict application success and later academic performance in medical school? A UK-based national cohort study.BMJ Open. 2019 Dec 29;9(12):e034437. doi: 10.1136/bmjopen-2019-034437. BMJ Open. 2019. PMID: 31888945 Free PMC article.
-
The validity of the selection methods for recruitment to UK core psychiatry training: cohort study.BJPsych Bull. 2024 Mar 27;49(1):1-10. doi: 10.1192/bjb.2024.9. Online ahead of print. BJPsych Bull. 2024. PMID: 38531805 Free PMC article.
-
Selection and academic success of medical students in Hamburg, Germany.BMC Med Educ. 2019 Jan 16;19(1):23. doi: 10.1186/s12909-018-1443-4. BMC Med Educ. 2019. PMID: 30651098 Free PMC article.
References
-
- Venables WN, Ripley BD. Modern applied statistics with S: springer. 2002.
-
- McManus I, Dewberry C, Nicholson S, Dowell JS, Woolf K, Potts HWW. Construct-level predictive validity of educational attainment and intellectual aptitude tests in medical student selection: meta-regression of six UK longitudinal studies. BMC Med. 2013;11:243. doi: 10.1186/1741-7015-11-243. - DOI - PMC - PubMed
-
- Friedman L, Wall M. Graphical views of suppression and multicollinearity in multiple linear regression. Am Stat. 2005;59(2):127–136. doi: 10.1198/000313005X41337. - DOI
-
- Lutz JG A method for constructing data which illustrate three types of suppressor variables. Educ Psych Meas. 1983;43(2):373–77.
Publication types
MeSH terms
Grants and funding
LinkOut - more resources
Full Text Sources
Other Literature Sources
Miscellaneous
