Review
. 2018 Aug;73(8):700-714.
doi: 10.1016/j.crad.2017.10.021. Epub 2017 Dec 9.

Clinical role of breast MRI now and going forward

Affiliations
Review

Clinical role of breast MRI now and going forward

D Leithner et al. Clin Radiol. 2018 Aug.

Abstract

Magnetic resonance imaging (MRI) is a well-established method in breast imaging, with manifold clinical applications, including the non-invasive differentiation between benign and malignant breast lesions, preoperative staging, detection of scar versus recurrence, implant assessment, and the evaluation of high-risk patients. At present, dynamic contrast-enhanced MRI is the most sensitive imaging technique for breast cancer diagnosis, and provides excellent morphological and to some extent also functional information. To compensate for the limited functional information, and to increase the specificity of MRI while preserving its sensitivity, additional functional parameters such as diffusion-weighted imaging and apparent diffusion coefficient mapping, and MR spectroscopic imaging have been investigated and implemented into the clinical routine. Several additional MRI parameters to capture breast cancer biology are still under investigation. MRI at high and ultra-high field strength and advances in hard- and software may also further improve this imaging technique. This article will review the current clinical role of breast MRI, including multiparametric MRI and abbreviated protocols, and provide an outlook on the future of this technique. In addition, the predictive and prognostic value of MRI as well as the evolving field of radiogenomics will be discussed.


Figures

Figure 1.
Figure 1.
Invasive ductal carcinoma grade 3 in the right breast in a 40-year-old woman at 3 T. (a) Unenhanced, (b) contrast-enhanced, and (c) maximum-intensity-projection DCE-MRI images showing irregular-shaped and marginated masses with extensive associated non-mass enhancement indicative of an extensive intraductal component in different quadrants of the right breast. (d) The index lesion demonstrates fast initial enhancement and a washout delayed phase (Type 3 curve). (e) On DWI with ADC mapping there is restricted diffusivity with decreased ADC values (0.971×10⁻³ mm2/s) associated with malignancy. (f) On the T2-weighted non-fat-saturated image there is associated peritumoural paraseptal oedema indicative of lymphangiosis carcinomatosa.
Figure 2.
Figure 2.
Fibroadenoma in the right breast in a 23-year-old woman at 7 T. (a) Unenhanced and (c) contrast-enhanced DCE-MRI images show that there are two oval masses with partly irregular margins centrally in the right breast. The medial lesion demonstrates a homogeneous and the lateral mass a heterogeneous internal enhancement pattern, but also non-enhancing septa. (d) Both lesions demonstrate an initial medium and then persistent enhancement. (b) On DWI, there is no restricted diffusivity with ADC values of 1.547×10⁻³ mm2/s. MP MRI of the breast accurately classified the lesion as BI-RADS 2 benign.
Figure 3.
Figure 3.
Comparison of a benign and malignant breast tumour on DWI with ADC mapping at 7 T. (a) On DCE-MRI, the benign lesion, which is a fibroadenoma, is oval, circumscribed, and shows non-enhancing septa. (b) On the high b-value (b=850) images the lesion is hyperintense due to a T2-shinethrough, but on the ADC map (c) there is no restricted diffusivity with ADC values of 2.226×10⁻³ mm2/s. (d) On DCE-MRI, the malignant lesion (invasive ductal carcinoma grade 3) is irregular shaped and marginated and shows heterogeneous enhancement. (e) On the high b-value (b=850) images, the lesion is hyperintense, and (f) on the ADC map, there is restricted diffusivity (i.e., hyperintense) with ADC values of 0.728×10⁻³ mm2/s.
Figure 4.
Figure 4.
Invasive ductal carcinoma in the right breast in a 46-year-old-woman at 3 T: (a) Maximum intensity projection, (b) unenhanced, and (c) contrast-enhanced DCE-MRI images show that there is an irregular-shaped and marginated mass with associated non-mass-enhancement indicative of an extensive intraductal component in the right breast retroareolar lateral. (d) On DWI with ADC mapping, there is restricted diffusivity with decreased ADC values (0.787×10⁻³ mm2/s), indicative of malignancy. (e) The lesion demonstrates fast initial enhancement and a washout delayed phase (Type 3 curve) and (f) pharmacokinetic modelling of the lesion shows a Ktrans and Kep, >0.25/min and >1/min, respectively; these quantitative parameters directly related to tissue perfusion/capillary permeability and were associated with malignancy. MP MRI of the breast with DCE-MRI and DWI allows an accurate classification as BI-RADS 5, which is highly suggestive of malignancy and enables pre-treatment staging.
Figure 5.
Figure 5.
Sclerosis adenosis in the right breast in a 39-year-old-woman at 7 T. (a) unenhanced, (b) initial contrast-enhanced, and (c) delayed contrast-enhanced DCE-MRI images show that there is irregular-shaped, marginated masses with heterogeneous enhancement centrally in the right breast and several other similar masses and foci in the vicinity. (e) The lesion, as well as the other areas, showed initial fast/persistent enhancement. (d) On DWI, there is no restricted diffusivity with ADC values of 1.480×10⁻³ mm2/s, indicative of benignity. In this patient, a BI-RADS 4 was assigned to the lesion owing to suspicious morphological and kinetic features in DCE-MRI, but an ADC value on DWI >1.39/mass ruled out malignancy and MP MRI accurately classified the lesion as a benign.
Figure 6.
Figure 6.
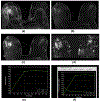
Invasive ductal carcinoma (grade 3) in the left breast of a 49-year-old female patient at 7 T. (a) Axial contrast-enhanced T1-weighted, fat-saturated, time-resolved angiography with stochastic trajectories MRI image shows initial strong contrast enhancement. (b) Corresponding axial Na-MRI image shows higher signal intensity in tumour tissue than the surrounding glandular tissue. (c) ADC map shows low ADC values inside the lesion (red region of interests [ROIs] are placed in lesions, and green ROIs are placed in healthy glandular tissue; 78). Reprinted with permission from: Zaric O, Pinker K, Zbyn S, et al. Quantitative sodium MR imaging at 7 T: initial results and comparison with diffusion-weighted imaging in patients with breast tumours. Radiology. 2016;280(1):39-48.
Figure 7.
Figure 7.
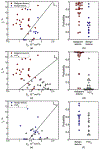
DWI-derived IVIM. Scatterplots of perfusion fraction (fp) versus true diffusion coefficient (Dd; left column) and the LDA-derived posterior probability (right column) of belonging to the lesion-of-interest class based on the combination of (Dd, fp) for differentiation between: (a,b) malignant lesions and benign lesions, (c,d) malignant lesions and fibroglandular tissue (FGT)M, and (e,f) benign lesions and FGTB. The solid lines in fp versus Dd plots indicate the linear discriminant analysis (LDA) decision boundaries: (a) L1 = −3.84 + 3.33×Dd/(10−3 mm2/s) −0.32×fp/(1%) = 0; (c) L2 = −5.38 + 5.40×Dd/(10−3 mm2/s) − 0.82×fp/(1%) = 0, and (e) L3 = −3.63 + 2.51×Dd/(10−3 mm2/s) − 0.25×fp/(1%) = 0 (95). Reprinted with permission from: Bokacheva L, Kaplan JB, Giri DD, et al. Intravoxel incoherent motion diffusion-weighted MRI at 3.0 T differentiates malignant breast lesions from benign lesions and breast parenchyma. J Magn Reson Imaging. 2014;40(4):813-823.
Figure 8.
Figure 8.
Radiogenomics. A machine-learning-based predictive model using image features extracted from MRI can distinguish invasive ductal carcinoma (IDC) subtypes based on some image features that are imperceptible to the eye. (a) Sagittal T1-weighted fat-suppressed post-contrast MRI of an ER and PR positive (ERPR+) invasive ductal carcinoma. (b) Sagittal T1-weighted fat-suppressed postcontrast MRI of an ERPR−/HER2 invasive ductal carcinoma. (c) Sagittal T1-weighted fat-suppressed post-contrast MRI of a triple-negative invasive ductal carcinoma (121). Reprinted with permission from: Sutton EJ, Dashevsky BZ, Oh JH, et al. Breast cancer molecular subtype classifier that incorporates MRI. J Magn Reson Imaging. 2016;44(1):122-129.
Figure 9.
Figure 9.
Receiver operated characteristics curves for the leave-one-case-out logistic regression classifiers by using computer-extracted image phenotypes as the decision variable for distinguishing between low to medium and high risk levels of recurrence for MammaPrint, Oncotype DX, PAM50 ROR-S, and PAM50 ROR-P, respectively (120). Reprinted with permission from: Li H, Zhu Y, Burnside ES, et al. MR imaging radiomics signatures for predicting the risk of breast cancer recurrence as given by research versions of MammaPrint, Oncotype DX, and PAM50 gene assays. Radiology. 2016;281(2):382-391.

References

    1. Sardanelli F, Boetes C, Borisch B, et al. Magnetic resonance imaging of the breast: recommendations from the EUSOMA working group. Eur J Cancer. 2010;46(8): 1296–1316. - PubMed
    1. Mann RM, Balleyguier C, Baltzer PA, et al. Breast MRI: EUSOBI recommendations for women’s information. Eur Radiol. 2015. - PMC - PubMed
    1. Pinker K, Bogner W, Baltzer P, et al. Clinical application of bilateral high temporal and spatial resolution dynamic contrast-enhanced MR imaging of the breast at 7 T. Eur Radiol. 2014;24(4):913–920. - PubMed
    1. Pinker-Domenig K, Bogner W, Gruber S, et al. High resolution MRI of the breast at 3 T: which BI-RADS(R) descriptors are most strongly associated with the diagnosis of breast cancer? Eur Radiol. 2012;22(2):322–330. - PubMed
    1. Morris EA. Diagnostic breast MR imaging: current status and future directions. Radiol Clin North Am. 2007;45(5):863–880, vii. - PubMed