. 2018 Mar 1;78(5):1140-1154.
doi: 10.1158/0008-5472.CAN-17-1947. Epub 2017 Dec 11.

Race Disparities in the Contribution of miRNA Isoforms and tRNA-Derived Fragments to Triple-Negative Breast Cancer

Affiliations

Race Disparities in the Contribution of miRNA Isoforms and tRNA-Derived Fragments to Triple-Negative Breast Cancer

Aristeidis G Telonis et al. Cancer Res. .

Abstract

Triple-negative breast cancer (TNBC) is a breast cancer subtype characterized by marked differences between White and Black/African-American women. We performed a systems-level analysis on datasets from The Cancer Genome Atlas to elucidate how the expression patterns of mRNAs are shaped by regulatory noncoding RNAs (ncRNA). Specifically, we studied isomiRs, that is, isoforms of miRNAs, and tRNA-derived fragments (tRF). In normal breast tissue, we observed a marked cohesiveness in both the ncRNA and mRNA layers and the associations between them. This cohesiveness was widely disrupted in TNBC. Many mRNAs become either differentially expressed or differentially wired between normal breast and TNBC in tandem with isomiR or tRF dysregulation. The affected pathways included energy metabolism, cell signaling, and immune responses. Within TNBC, the wiring of the affected pathways with isomiRs and tRFs differed in each race. Multiple isomiRs and tRFs arising from specific miRNA loci (e.g., miR-200c, miR-21, the miR-17/92 cluster, the miR-183/96/182 cluster) and from specific tRNA loci (e.g., the nuclear tRNAGly and tRNALeu, the mitochondrial tRNAVal and tRNAPro) were strongly associated with the observed race disparities in TNBC. We highlight the race-specific aspects of transcriptome wiring by discussing in detail the metastasis-related MAPK and the Wnt/β-catenin signaling pathways, two of the many key pathways that were found differentially wired. In conclusion, by employing a data- and knowledge-driven approach, we comprehensively analyzed the normal and cancer transcriptomes to uncover novel key contributors to the race-based disparities of TNBC.Significance: This big data-driven study comparing normal and cancer transcriptomes uncovers RNA expression differences between Caucasian and African-American patients with triple-negative breast cancer that might help explain disparities in incidence and aggressive character. Cancer Res; 78(5); 1140-54. ©2017 AACR.


Conflict of interest statement

Conflict of Interest: None

Figures

Figure 1
Figure 1. A complex race- and state-specific transcriptomic landscape
A–B: Commonly up-regulated (A) and down-regulated (B) mRNAs, grouped by KEGG pathways, isomiRs and tRFs. The shown pathways, miRNA arms, and mature tRNAs capture the mRNAs, isomiRs and tRFs, respectively, that are DE between normal breast and TNBC, independently of race. X-axis: mean value in the two races. Pathways such as “Parkinson’s disease” are shown enriched due to characteristics they share with TNBC, e.g. oxidative phosphorylation deregulation (Supplementary Table S2). C: Examples of miRNAs and tRNAs whose isomiRs and tRFs are anti-correlated with the shown mRNAs: both isomiRs/tRFs and mRNAs are DE in opposite directions between normal breast and TNBC. The lines connecting the miRNAs/tRNAs and the genes show that isomiRs/tRFs from the respective loci are predicted to target the mRNAs from this gene. Green edges indicate that the archetype miRNA is among the produced isoforms from the locus that are anti-correlated with the shown mRNA. The mRNAs are colored based on the pathway they participate. Ox-Phos: Oxidative phosphorylation. D–E: KEGG pathways that are enriched in a race-specific manner in mRNAs that are up-regulated (D) or down-regulated (E) in TNBC compared to normal.
Figure 2
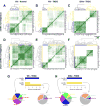
Figure 2. MRNA hubs and their neighbors
The heatmaps of panels A–F visualize the matrix of Jaccard indices of the shared connections for the top 50 mRNA hubs. A–C: the hubs are compared by examining their immediate mRNA neighbors (mRNA-Jaccard index). D–F: the hubs are compared by examining their immediate short ncRNA neighbors (isomiR/tRF-Jaccard index). The higher the Jaccard index between two hubs the higher the number of shared first neighbors (see Materials and Methods). A and D: normal breast, Wh donors. B and E: Wh TNBC patients. C and F: B/Aa TNBC patients. G–H: Number of isomiRs/tRFs that are first neighbors of the mRNA hubs in Wh-TNBC (G) and B/Aa-TNBC (H). IsomiRs and tRFs are broken down by cluster (orange or blue, as identified in B and C for each race). The pie charts show the composition of the respective bar of the histogram.
Figure 3
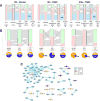
Figure 3. The mRNA associations within a state can be largely explained by short ncRNAs and common transcription factors
A: Alluvial diagrams representing the percentage of mRNA couplings that are associated with each factor. The percentage in blue shows the fraction of mRNA couplings that cannot be explained by any of the considered factors. An asterisk (*) indicates that this percentage is significantly higher than expected by chance whereas a cross (+) that it is lower. Statistical significance was assessed with Monte-Carlo simulations with a threshold of an absolute Z-Score of at least 2.0 as compared to the constructed expected distribution. B: Alluvial diagrams showing the percentage (also shown below each label) of mRNA co-expression pairs that can be projected to the same isomiR, tRF or TF in each state. The gray fields are proportional to the overlap among the clusters. The pie charts show the sign (negative/blue, positive/orange) for those of the co-expressed pairs that are also associated with the corresponding regulator. The TF values are shown boxed to indicate the possibility that the percentage is an overestimate (see also text). C: Example sub-networks comprising mRNAs (circles) that are co-expressed with isomiRs or tRFs from the shown miRNA (orange diamonds) or tRNA (magenta diamonds) loci in Wh TNBC patients. Blue edges indicate co-expressed and positively-correlated mRNA-mRNA pairs. Gray edges represent miRNA or tRNA loci whose isomiRs or tRFs are co-expressed with the corresponding mRNAs. All shown miRNA-mRNA pairs capture negative correlations. The shown tRF-mRNA pairs capture either positive or negative correlations.
Figure 4
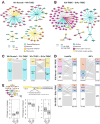
Figure 4. IsomiRs and tRFs as potential drivers of differentially wired mRNAs
A–B: The panels show CW and DW mRNAs when comparing normal breast and TNBC in Wh donors (A), or, the TNBC state between Wh and B/Aa patients (B). The mRNA nodes are colored by pathway. C: Alluvial diagram showing the percentage of the DW associations that can be attributed to differential wiring (box “different”) with an isomiR (left column of each panel) or a tRF (right column of each panel). The box “same” captures the percentage of DW mRNA-mRNA pairs that are either not correlated with isomiRs/tRFs or the correlations with isomiRs/tRFs are CW between the two tissue states or races. The percentage numbers noted in red show the fraction of DW mRNA associations that cannot be attributed to DW with isomiRs or tRFs. For example, 86% and 97% of the DW associations between Wh-Normal and Wh-TNBC can be attributed to DW with an isomiR and a tRF, respectively. The gray area connecting the columns represents the overlap: in the left plot, almost all of the DW mRNA pairs that are DW with isomiRs are also DW with tRFs. D: Alluvial diagrams showing how the isomiRs and tRFs are differentially wired with the DW mRNA associations between the normal breast and TNBC in Wh donors (top panels) and between Wh TNBC and B/Aa TNBC patients (bottom panels). Each “Pos” (“Neg” respectively) block indicates the portion of DW mRNA pairs that are positively (negatively, respectively) correlated with at least one isomiR/tRF in the corresponding state. The “Pos/Neg” block captures the portion of DW mRNA pairs that are both positively- and negatively-correlated with isomiRs/tRFs. “None” captures the portion of DW mRNA pairs that cannot be correlated with any isomiRs/tRF. E: DW of RTN4 as a result of differential targeting by isomiRs. RTN4 is DW with isomiRs and tRFs from several different loci when comparing the Wh-Normal and Wh-TNBC state (top left of the panel). The archetype miRNA of miR-200b-3p has a putative target site only in one of the two mRNA isoforms of RTN4 (top right panel). The RTN4 mRNA isoforms are differentially expressed between the normal tissue and tumor in Wh patients (bottom boxplots). Asterisks indicate statistically significant differences (P<0.05; Mann-Whitney U test). Panels A, B, and E: the shown DW transcripts capture the absence of co-expression in one of the states being compared. Panels A, B, and E: the edges connecting DW transcripts are colored by the state in which the transcripts are co-expressed.
Figure 5
Figure 5. Race-specific metastasis-related genes and pathways
A: MRNA and protein levels of E-Cadherin (CDH1), a marker of metastatic potential show differential expression between the two races in TNBC. *: P<0.05; Mann-Whitney U test. B: DW tRFs and mRNAs participating in MAPK signaling. The shown correlations between tRFs and mRNAs are present only in Wh TNBC patients. Shown are tRNA loci (diamonds) that produce tRFs that are correlated with the mRNAs of the shown genes (circles) as well as PPIs among the protein products of these genes. PEBP1 is also known as RKIP and MAPK14 is known as P38. C: PPI network and DW associations of the corresponding mRNAs with isomiRs/tRFs of the Wnt/β-catenin signaling pathway as integrated from KEGG, Pickle and UniProt databases. The shown DW associations correspond to an absence of co-expression in one of the states. The edges connecting DW transcripts are colored by the state in which the transcripts are co-expressed. Gene nodes are sorted based on the cellular compartment of the encoded protein, from extracellular (left hand-side) to nuclear (right hand-side). The full list of how the Wnt/β-catenin pathway genes are DW with isomiRs and tRFs is included in Supplementary Table S7.

References

    1. Siegel RL, Miller KD, Jemal A. Cancer statistics, 2016. CA Cancer J Clin. 2016;66:7–30. - PubMed
    1. Dawson SJ, Provenzano E, Caldas C. Triple negative breast cancers: clinical and prognostic implications. Eur J Cancer. 2009;45(Suppl 1):27–40. - PubMed
    1. Ademuyiwa FO, Edge SB, Erwin DO, Orom H, Ambrosone CB, Underwood W., 3rd Breast cancer racial disparities: unanswered questions. Cancer Res. 2011;71:640–4. - PubMed
    1. Williams DR, Mohammed SA, Shields AE. Understanding and effectively addressing breast cancer in African American women: Unpacking the social context. Cancer. 2016;122:2138–49. - PMC - PubMed
    1. Dietze EC, Sistrunk C, Miranda-Carboni G, O'Regan R, Seewaldt VL. Triple-negative breast cancer in African-American women: disparities versus biology. Nat Rev Cancer. 2015;15:248–54. - PMC - PubMed

Publication types

LinkOut - more resources