Comparative Study
. 2017 Dec 26;114(52):E11121-E11130.
doi: 10.1073/pnas.1714381115. Epub 2017 Dec 11.

Comparative transcriptomics as a guide to natural product discovery and biosynthetic gene cluster functionality

Affiliations
Comparative Study

Comparative transcriptomics as a guide to natural product discovery and biosynthetic gene cluster functionality

Gregory C A Amos et al. Proc Natl Acad Sci U S A. .

Abstract

Bacterial natural products remain an important source of new medicines. DNA sequencing has revealed that a majority of natural product biosynthetic gene clusters (BGCs) maintained in bacterial genomes have yet to be linked to the small molecules whose biosynthesis they encode. Efforts to discover the products of these orphan BGCs are driving the development of genome mining techniques based on the premise that many are transcriptionally silent during normal laboratory cultivation. Here, we employ comparative transcriptomics to assess BGC expression among four closely related strains of marine bacteria belonging to the genus Salinispora The results reveal that slightly more than half of the BGCs are expressed at levels that should facilitate product detection. By comparing the expression profiles of similar gene clusters in different strains, we identified regulatory genes whose inactivation appears linked to cluster silencing. The significance of these subtle differences between expressed and silent BGCs could not have been predicted a priori and was only revealed by comparative transcriptomics. Evidence for the conservation of silent clusters among a larger number of strains for which genome sequences are available suggests they may be under different regulatory control from the expressed forms or that silencing may represent an underappreciated mechanism of gene cluster evolution. Coupling gene expression and metabolomics data established a bioinformatic link between the salinipostins and their associated BGC, while genetic manipulation established the genetic basis for this series of compounds, which were previously unknown from Salinispora pacifica.

Keywords: Salinispora; biosynthetic gene cluster; specialized metabolism; transcriptomics.


Conflict of interest statement

The authors declare no conflict of interest.

Figures

Fig. 1.
Fig. 1.
BGC distributions among strains. BGCs in bold font have been linked to their product. *But1/spt was assigned as part of this study. TBD, BGC products remain to be determined. Unassigned BGCs were named based on bioinformatic predictions (Lan, lantibiotic; NRPS, nonribosomal peptide synthetase; PKS/NRPS, hybrid; Sid, siderophore). Box colors: white, BGC not present; gray, BGC silent; red, BGC expressed; red with diagonal lines, BGC expressed and products detected. CNB-440: S. tropica, CNT-150: S. pacifica, CNS-991: S. arenicola, CNS-205: S. arenicola. Isopimara-8,15-dien-19-ol from the ido BGC may not represent the end product of this BGC, and thus was excluded from calculations of product detection from characterized BGCs. NA, not applicable.
Fig. 2.
Fig. 2.
BGC transcription during exponential (96 h, green) and stationary (216 h, blue) growth in four Salinispora strains. Expression levels (y axis) are expressed as RPKM. The threshold for distinguishing between silent and expressed BGCs is indicated by a dashed line. The BGCs observed in each strain are listed on the x axis and assigned formal names in cases where the products are known. But1 was experimentally verified as part of this study. BGCs for which the products were detected are indicated with an asterisk (*).
Fig. 3.
Fig. 3.
STPKS1 and PKS1A BGCs. (A) Comparative genomics of the STPKS1 BGC observed in S. pacifica strain CNT-150 and S. tropica strain CNB-440. Blue ORFs indicate the core biosynthetic operon, including PKS genes. (B) Differences in the expression (RPKM) of core biosynthetic genes (blue) and araC regulator (red) between S. pacifica and S. tropica. Similar differences in expression were observed across the downstream portions of the BGCs. (C) Comparative genomics of the PKS1A BGC observed in two S. arenicola strains. Blue ORFs indicate the core biosynthetic operon, including PKS genes. Red ORFs indicate regulator elements, including a sigma factor. (D) Differences in the expression (RPKM) of core biosynthetic genes (blue) and sigma factor (red) between S. arenicola CNS-205 and S. arenicola CNS-991.
Fig. 4.
Fig. 4.
PKS4 expression. (A) Comparison of the PKS4 BGC in four Salinispora strains. Dark red, luxR homolog 1; light red, luxR homolog 2; bright yellow, conserved crcB proteins (ion exporters). The BGC was divided into left (PKS4B, dark blue) and right (PKS4A, light blue) regions based on the expression patterns. (B) Expression levels of PKS4A (light blue) and PKS4B (dark blue) reported in RPKM.
Fig. 5.
Fig. 5.
Staurosporine BGC. (A) Comparative analysis of the staurosporine (sta) BGC in three Salinispora strains. Core biosynthetic operon (blue) and malT (red, luxR homolog) were observed in both S. arenicola strains and malT-like (82% amino acid identity) ATP-dependent transcriptional regulator in S. pacifica CNT-150. The upstream purple ORF present in both S. arenicola strains but absent in S. pacifica is annotated as a major facilitator superfamily transporter. These are known drug efflux proteins that contribute to antibiotic resistance. (B) Average expression of the sta biosynthetic operon in each of the three strains (blue) and expression of the regulatory element (red) are illustrated. Expression values are given in RPKM.
Fig. 6.
Fig. 6.
MS/MS molecular network. CNT-150 culture extracts were networked with a database of MS/MS data previously acquired from Salinispora strains. Nodes containing fragmentation spectra that matched library reference spectra are represented as triangles or arrowheads and labeled with the compound name. Nodes containing parent ions not observed in CNT-150 are colored purple, nodes observed in the database and CNT-150 are colored blue, and nodes containing parent ions unique to CNT-150 are colored red.
Fig. 7.
Fig. 7.
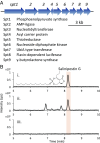
Experimental characterization of the but1 (spt) BGC. (A) Salinipostin (spt) BGC. (B) Extracted ion chromatograms for (i) salinipostin G standard; (ii) extract of wild-type S. tropica CNB-440 (peaks at 6.8–7.8 min show [M+H]+ and [M+Na]+ spectra identical with salinipostin G, and therefore likely to correspond to different salinipostin isomers); and (iii) the extract of S. tropica CNB-440/∆spt9.

References

    1. Newman DJ, Cragg GM. Natural products as sources of new drugs over the 30 years from 1981 to 2010. J Nat Prod. 2012;75:311–335. - PMC - PubMed
    1. Harvey AL. Natural products in drug discovery. Drug Discov Today. 2008;13:894–901. - PubMed
    1. Bachmann BO, Van Lanen SG, Baltz RH. Microbial genome mining for accelerated natural products discovery: Is a renaissance in the making? J Ind Microbiol Biotechnol. 2014;41:175–184. - PMC - PubMed
    1. Medema MH, Fischbach MA. Computational approaches to natural product discovery. Nat Chem Biol. 2015;11:639–648. - PMC - PubMed
    1. Zhang JJ, Moore BS. Digging for biosynthetic dark matter. Elife. 2015;4:e06453. - PMC - PubMed

Publication types

MeSH terms

Substances

Associated data