. 2017 Dec 26;114(52):13762-13767.
doi: 10.1073/pnas.1704093114. Epub 2017 Dec 11.

Critical dynamics in population vaccinating behavior

Affiliations

Critical dynamics in population vaccinating behavior

A Demetri Pananos et al. Proc Natl Acad Sci U S A. .

Abstract

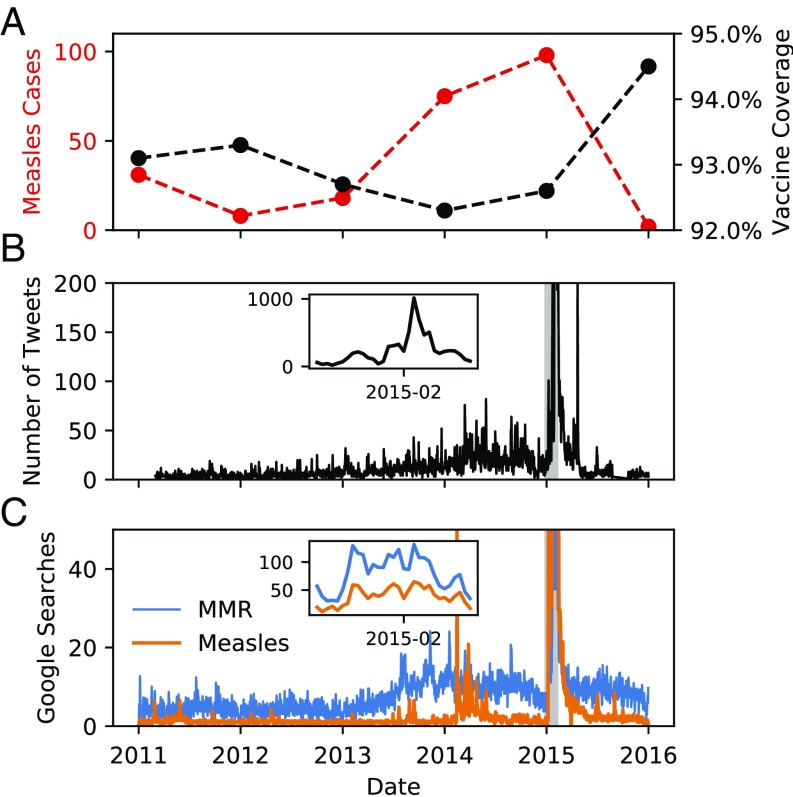
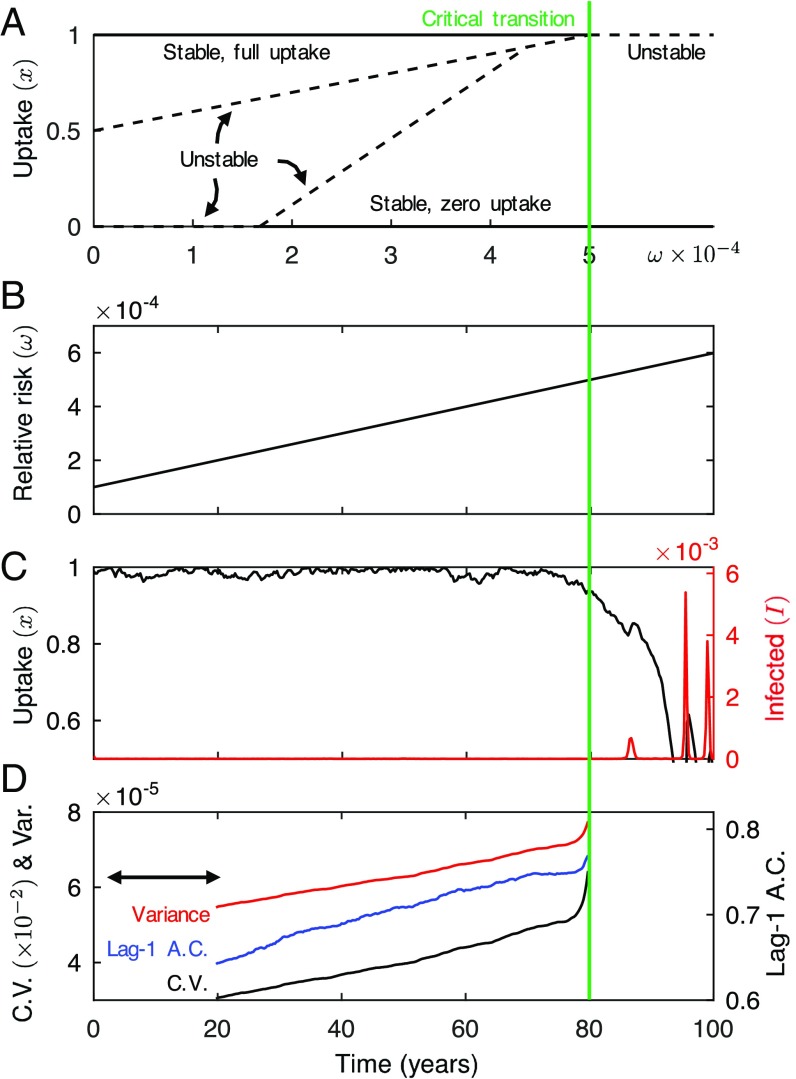
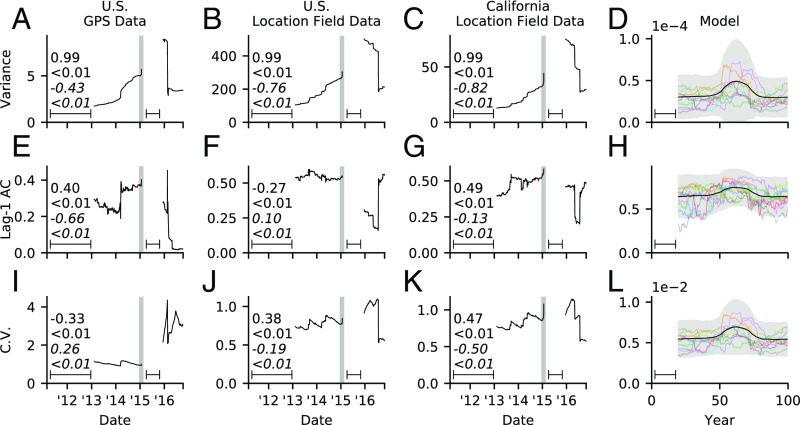
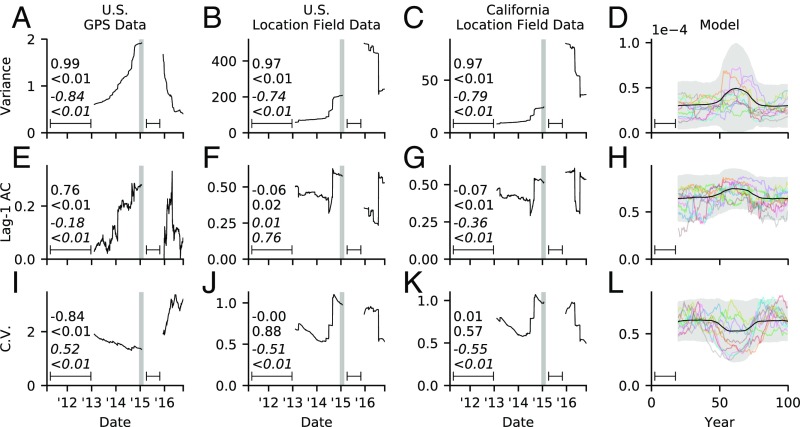
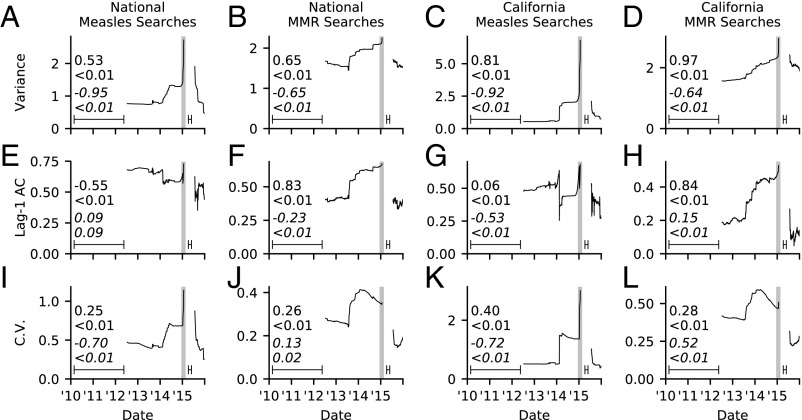
Vaccine refusal can lead to renewed outbreaks of previously eliminated diseases and even delay global eradication. Vaccinating decisions exemplify a complex, coupled system where vaccinating behavior and disease dynamics influence one another. Such systems often exhibit critical phenomena-special dynamics close to a tipping point leading to a new dynamical regime. For instance, critical slowing down (declining rate of recovery from small perturbations) may emerge as a tipping point is approached. Here, we collected and geocoded tweets about measles-mumps-rubella vaccine and classified their sentiment using machine-learning algorithms. We also extracted data on measles-related Google searches. We find critical slowing down in the data at the level of California and the United States in the years before and after the 2014-2015 Disneyland, California measles outbreak. Critical slowing down starts growing appreciably several years before the Disneyland outbreak as vaccine uptake declines and the population approaches the tipping point. However, due to the adaptive nature of coupled behavior-disease systems, the population responds to the outbreak by moving away from the tipping point, causing "critical speeding up" whereby resilience to perturbations increases. A mathematical model of measles transmission and vaccine sentiment predicts the same qualitative patterns in the neighborhood of a tipping point to greatly reduced vaccine uptake and large epidemics. These results support the hypothesis that population vaccinating behavior near the disease elimination threshold is a critical phenomenon. Developing new analytical tools to detect these patterns in digital social data might help us identify populations at heightened risk of widespread vaccine refusal.

Keywords: early warning signals; machine learning; online social media; socioecological systems; vaccine refusal.


Conflict of interest statement

The authors declare no conflict of interest.

Figures

Fig. 1.
Fig. 1.
Interactions between disease spread, vaccine uptake, and online activity before, during, and after the 2014–2015 Disneyland, California measles outbreak. (A) Kindergarten MMR vaccine uptake (black; note vertical scale) and measles case notifications in California (red): year in horizontal axis for vaccine uptake corresponds to the ending calendar year of the corresponding academic year (e.g., 2016 means 2015–2016 academic year). Case notifications in 2016 go only to November 18. Most 2014 cases occurred at the end of the year. (B) Number of US geocoded tweets for measles-relevant search terms, 2011–2016, with a sharp spike in early 2015 corresponding to Disneyland measles outbreak. (C) GT Internet search index for MMR (blue) or measles (orange) in California, 2011–2016, with a sharp spike in early 2015 corresponding to the Disneyland measles outbreak. Shaded region in B and C indicates outbreak time period. See SI Appendix, sections S1 and S2 for details on search terms, data sources, and data extraction.
Fig. 2.
Fig. 2.
Coupled behavior–disease model shows early warning signals as perceived risk increases toward a critical transition. Green line indicates location/time of critical transition in all panels. (A) Bifurcation diagram of vaccine uptake showing a critical transition from full to zero vaccine uptake when perceived relative risk (ω) exceeds social norm strength (δ) (solid lines are stable branches; dashed are unstable). (B) ω (solid line) increasing linearly past critical transition at ω = δ. (C) Vaccine uptake (black) and infection prevalence (red) as ω increases as in B. (D) Variance (red), lag-1 AC (blue), and coefficient of variation (black) for the time series in C (mean values at each time point across 500 realizations). Methodological details appear in Methods and SI Appendix, sections S3 and S4.
Fig. 3.
Fig. 3.
CSD provaccine tweets before and after Disneyland measles outbreak. (AD) Variance, (EH) lag-1 AC, and (IL) coefficient of variation for (A, E, and I) US GPS, (B, F, and J) US Location Field, (C, G, and K) California Location Field data, and (D, H, and l) model. The residual time series was used for variance and lag-1 AC. Kendall tau rank correlation coefficients are displayed before (regular font) and after (italic) the Disneyland peak with P values denoted by <. Window width used to compute rolling averages is indicated by line interval. Shaded region indicates outbreak time period. Model panels show indicators averaged across 500 stochastic model realizations (black), 2 SDs (shaded), and 10 example realizations (colored lines). See Methods and SI Appendix, sections S3–S5 for details.
Fig. 4.
Fig. 4.
CSD in antivaccine tweets before and after Disneyland measles outbreak. (AD) Variance, (EH) lag-1 AC, and (IL) coefficient of variation for (A, E, and I) US GPS, (B, F, and J) US Location Field, (C, G, and K) California Location Field data, and (D, H, and I) model. The residual time series was used for variance and lag-1 AC. Kendall tau rank correlation coefficients are displayed before (regular font) and after (italic) the Disneyland peak with P values denoted by <. Window width used to compute rolling averages is indicated by line interval. Shaded region indicates outbreak time period. Model panels show indicators averaged across 500 stochastic model realizations (black), 2 SDs (shaded), and 10 example realizations (colored lines). See Methods and SI Appendix, sections S3–S5 for details.
Fig. 5.
Fig. 5.
CSD in GT search index before and after Disneyland measles outbreak. (AD) Variance, (EH) lag-1 AC, and (IL) coefficient of variation for (A, E, and I) US searches for measles, (B, F, and J) US searches for MMR, (C, G, and K) California searches for measles, and (D, H, and L) California searches for MMR. The residual time series was used for variance and lag-1 AC. Kendall tau rank correlation coefficients are displayed before (regular font) and after (italic) the Disneyland peak with P values denoted by <. Window width used to compute rolling averages is indicated by line interval. Shaded region indicates outbreak time period. See Methods and SI Appendix, section S4 for details.

References

    1. Jegede AS. What led to the Nigerian boycott of the polio vaccination campaign? PLoS Med. 2007;4:e73. - PMC - PubMed
    1. Omer SB, Orenstein WA, Koplan JP. Go big and go fast—vaccine refusal and disease eradication. N Engl J Med. 2013;368:1374–1376. - PubMed
    1. California Department of Public Health 2017 Kindergarten immunization levels. Available at http://www.shotsforschool.org/k-12/reporting-data/. Accessed February 4, 2016.
    1. Majumder MS, Cohn EL, Mekaru SR, Huston JE, Brownstein JS. Substandard vaccination compliance and the 2015 measles outbreak. JAMA Pediatr. 2015;169:494–495. - PMC - PubMed
    1. Zipprich J, et al. 2015 Measles outbreak—California, December 2014–February 2015. MMWR Morb Mortal Wkly Rep 64:153–154. Available at https://www.cdc.gov/mmwr/preview/mmwrhtml/mm6406a5.htm. Accessed November 20, 2017.

Publication types

Substances

LinkOut - more resources