. 2017 Dec 26;114(52):E11276-E11284.
doi: 10.1073/pnas.1714877115. Epub 2017 Dec 11.

Identification of cancer genes that are independent of dominant proliferation and lineage programs

Affiliations

Identification of cancer genes that are independent of dominant proliferation and lineage programs

Laura M Selfors et al. Proc Natl Acad Sci U S A. .

Abstract

Large, multidimensional cancer datasets provide a resource that can be mined to identify candidate therapeutic targets for specific subgroups of tumors. Here, we analyzed human breast cancer data to identify transcriptional programs associated with tumors bearing specific genetic driver alterations. Using an unbiased approach, we identified thousands of genes whose expression was enriched in tumors with specific genetic alterations. However, expression of the vast majority of these genes was not enriched if associations were analyzed within individual breast tumor molecular subtypes, across multiple tumor types, or after gene expression was normalized to account for differences in proliferation or tumor lineage. Together with linear modeling results, these findings suggest that most transcriptional programs associated with specific genetic alterations in oncogenes and tumor suppressors are highly context-dependent and are predominantly linked to differences in proliferation programs between distinct breast cancer subtypes. We demonstrate that such proliferation-dependent gene expression dominates tumor transcriptional programs relative to matched normal tissues. However, we also identified a relatively small group of cancer-associated genes that are both proliferation- and lineage-independent. A subset of these genes are attractive candidate targets for combination therapy because they are essential in breast cancer cell lines, druggable, enriched in stem-like breast cancer cells, and resistant to chemotherapy-induced down-regulation.

Keywords: bioinformatics; breast cancer; gene expression; oncogene; tumor biology.


Conflict of interest statement

The authors declare no conflict of interest.

Figures
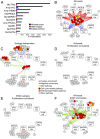
Fig. 1.
Fig. 1.
Genes and pathways associated with common genetic alterations in breast tumors. (A) Bar graph of the number genes associated with the 10 most common genetic alterations found in the entire TCGA breast dataset (“all-breast,” black), within any of the four major breast molecular subtypes (“within-subtype,” red) or after subtype-centering (“subtype-centered,” blue). (BF) GeneGo Pathway Maps (circles) and genetic alterations (rounded rectangles) are connected by lines representing significant positive (red lines) or negative (blue lines) enrichment in mRNA levels in tumors bearing the indicated genetic alteration. Green lines indicate new pathways not identified in the all-breast enrichment. Pathways related to proliferation or DNA damage are indicated in red or orange, respectively. Threshold for statistical significance was false discovery rate corrected; P < 0.05, hypergeometric test. Pathway enrichment results are depicted from the all-breast (B), subtype-independent (C), proliferation-normalized all-breast (D), proliferation-normalized within-subtype (E), and the ESR1-normalized all-breast (F) analyses.
Fig. 2.
Fig. 2.
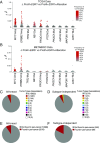
The contribution of genetic alterations to gene expression beyond proliferation, tumor lineage, and in multiple tumor types. (A and B) Multiple linear regression models depicting the contribution of genetic alterations to gene expression when proliferation and ESR1 are taken into account. Each point represents the difference in adjusted r2 (Δr2) between the proliferation + ESR1 and the proliferation + ESR1 + genetic alterations models that were found to be significantly different (P < 0.05, likelihood ratio test of nested models). Red coloring indicates the frequency of coamplification/deletion. Results from the TCGA breast cancer (A) and METABRIC (B) datasets are presented. (C and D) Pie charts depicting the number of other tumor types in which the all-breast (C) and subtype-independent (D) gene:alteration associations for the 10 most common alterations are found. (E and F) Pie charts depicting the number of gene:alteration associations from the all-breast (E) and subtype-independent (F) analyses of the 10 most common alterations that are found in a pan-cancer dataset.
Fig. 3.
Fig. 3.
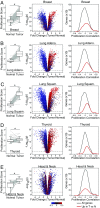
Proliferation-dependent and proliferation-independent gene expression in tumors and matched normal samples. Proliferation-dependent expression in tumor and matched normal samples from TCGA breast (BRCA, n = 113) (A), lung adenocarcinoma (Adeno.; n = 57) (B), lung squamous (Squam.; n = 51) (C), thyroid (n = 59) (D), and head and neck (n = 42) (E) datasets. Box plots show the proliferation scores of matched tumor and normal samples. Lines connect samples from the same patient, and box plot summarizes the data. Volcano plots represent the gene-level log-fold change of tumor vs. normal (x axis) and −log(P) (y axis) where P is derived from paired Welch’s t tests. Each data point represents a gene and is colored according to its correlation with proliferation, where red indicates a positive correlation and blue indicates a negative correlation. *P > 0.05 paired Welch’s t test. Histograms are the degree to which genes correlate with the proliferation score. The black line is all expressed genes, and the red line is the genes that are up in tumors relative to normal.
Fig. 4.
Fig. 4.
Proliferation- and lineage-independent pathways and genes. (A) Venn diagram of GeneGo pathways that are enriched in genes elevated in tumors relative to normal in breast and four additional tumor types (TA genes, peach), and the subset of these genes that are proliferation-independent (TANP genes, green). Table lists the TANP-enriched pathways and genes. (B) Effect of chemotherapy on gene expression. Heat map represents the fold change (log2 ratios) in mRNA levels pre- and postchemotherapy treatment for TAP and TANP genes. Red indicates higher expression after chemotherapy treatment, and blue indicates lower expression. (C) Differential effect of chemotherapy on gene expression of proliferation-dependent and proliferation-independent genes. Box plot shows the fold change in mRNA (log2 ratio) before and after chemotherapy of TAP (n = 509) and TANP (n = 320) genes. *P < 0.05, Student’s t test. (D) Gene expression in ALDH+/− cells. Heat map represents the fold change (log2 ratios) in TAP and TANP gene expression in ALDH+ vs. ALDH breast tumor cells. (E) Gene expression of proliferation-dependent and proliferation-independent genes in ALDH+ cells relative to ALDH cells. Box plot shows the fold change in mRNA (log2 ratio) of TAP (n = 555) and TANP (n = 343) genes. *P < 0.05, Student’s t test. (F) Table lists the TANP genes that are druggable, essential in shRNA drop-out screens, not down-regulated by chemotherapy, and enriched in ALDH+ stem-like cancer cells.

References

    1. Vogelstein B, et al. Cancer genome landscapes. Science. 2013;339:1546–1558. - PMC - PubMed
    1. Forbes SA, et al. COSMIC: Exploring the world’s knowledge of somatic mutations in human cancer. Nucleic Acids Res. 2015;43:D805–D811. - PMC - PubMed
    1. Cerami E, et al. The cBio cancer genomics portal: An open platform for exploring multidimensional cancer genomics data. Cancer Discov. 2012;2:401–404. - PMC - PubMed
    1. Weinstein IB. Cancer. Addiction to oncogenes: The Achilles heal of cancer. Science. 2002;297:63–64. - PubMed
    1. Ross JS, et al. Targeted therapies for cancer 2004. Am J Clin Pathol. 2004;122:598–609. - PubMed

Publication types