. 2017 Dec 11;8(1):2029.
doi: 10.1038/s41467-017-02099-7.

Post-transcriptional 3´-UTR cleavage of mRNA transcripts generates thousands of stable uncapped autonomous RNA fragments

Affiliations

Post-transcriptional 3´-UTR cleavage of mRNA transcripts generates thousands of stable uncapped autonomous RNA fragments

Yuval Malka et al. Nat Commun. .

Abstract

The majority of mammalian genes contain one or more alternative polyadenylation sites. Choice of polyadenylation sites was suggested as one of the underlying mechanisms for generating longer/shorter transcript isoforms. Here, we demonstrate that mature mRNA transcripts can undergo additional cleavage and polyadenylation at a proximal internal site in the 3'-UTR, resulting in two stable, autonomous, RNA fragments: a coding sequence with a shorter 3'-UTR (body) and an uncapped 3'-UTR sequence downstream of the cleavage point (tail). Analyses of the human transcriptome has revealed thousands of such cleavage positions, suggesting a widespread post-transcriptional phenomenon producing thousands of stable 3'-UTR RNA tails that exist alongside their transcripts of origin. By analyzing the impact of microRNAs, we observed a significantly stronger effect for microRNA regulation at the body compared to the tail fragments. Our findings open a variety of future research prospects and call for a new perspective on 3'-UTR-dependent gene regulation.


Conflict of interest statement

The authors declare no competing financial interests.

Figures
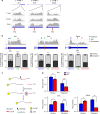
Fig. 1
Fig. 1
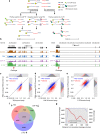
Cleavage of 3′-UTR regions results in autonomous uncapped RNA fragments. a RNA-seq read coverage (y-axis) for Ssr1, Bcl2, and Rab2a in mouse T cells, B cells, and brain tissue, demonstrating a gap in read coverage (marked by arrows) at 3′-UTRs, as well as uneven levels of RNA upstream and downstream of the gap site. b Three sets of primers were used per gene for qRT-PCR amplification: upstream (blue rectangle), downstream (red), and across the RNA-seq coverage gap (green). Bar plots (bottom) visualize the relative percentage of cytoplasmic (black) and nuclear (gray) expression of each amplicon out of its total (cytoplasm+nuclear) expression. c A model for post-transcriptional processing of mRNA: mRNA is cleaved at an APA site, resulting in a capped “body” and an uncapped 3′-UTR “tail,” sensitive to terminator 5′-phosphate-dependent exonuclease (TEX) treatment. d qRT-PCR analysis shows cytoplasmic degradation of the “tail” unit (in red) compared to the “body” unit (in blue) following TEX treatment. *p < 0.05, **p < 0.01 and ***p < 0.001 (two-tailed Student’s t-test). Results are representative of three independent experiments (b, d). Error bars = s.d.
Fig. 2
Fig. 2
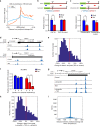
Transcriptome-wide analysis of 3′-UTR regions identifies thousands of stable cleaved tails. a We used three experimental methods to measure separated body and tail RNA fragments at a transcriptome-wide scale; poly(A) selected RNA from U2OS cells was enriched for 5′-capped bodies using TEX treatment (TEX) or anti-Cap immunoprecipitation (CAP IP); uncapped tails were enriched by streptavidin bead pulldown of in vitro biotinylated-7-methylguanylate capped RNA (3′-PD). b RNA-seq read coverage data (y-axis) across the putative cleavage point of SLC38A2 and LBH (arrow) show reduced “tail” read coverage in TEX- and CAP IP-treated cells compared to enriched “tails” in 3′-PD, and equal coverage in untreated RNA (control). Black horizontal lines mark average coverage across exons. ce Computational analysis using a Hidden Markov Model (HMM) was applied to identify the most probable cleavage point for each transcript, resulting in 12,578 statistically significant transcripts (Kolmogorov–Smirnov p < 0.01) for TEX (overall of 6068 cleaved genes, FDR < 0.01); 11,108 transcripts for CAP IP (5222 genes); and 14,589 transcripts for 3′-PD (6501 genes). Shown are density plots comparing the relative read coverage (normalized over coding region, genome wide) before and after treatment, for bodies (x-axis) and tails (y-axis) for TEX (c), CAP IP (d), and 3′-PD (e). Red dots correspond to transcripts predicted to be cleaved, and blue dots mark non-cleaved transcripts. Histograms above and to the right of each plot show the marginal distribution of body or tail treated to untreated RNA-seq ratio for each population. f Venn diagram of genes with statistically significant differences in body vs. tail read coverage (FDR < 0.01) for TEX, CAP IP, and 3′-PD. g Meta-gene analysis of average read coverage (paired-end RNA-seq; red line) showing a dip at the putative cleavage point (predicted in TEX treatment data). Blue line shows meta-gene plot of exon annotations, suggesting that the observed dip is not due to exon–intron junctions
Fig. 3
Fig. 3
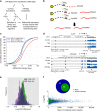
3′-UTR processing is APA-dependent and occurs post-transcriptionally. a Distribution of HEK-293 polyadenylation sites (from PolyASite) surrounding the predicted cleavage point (HMM, in orange line) or random points in random UTRs (blue line). b, c Mutations in APA sites diminish cleavage. Mutation of 3′-UTR APA sites cloned into a pGL3 promoter luciferase reporter system shows reduced cytoplasmic sensitivity to TEX in RAP1B (b) and ST6GALNAC4 (c). d 3′-end RNA-seq data (y-axis) for DDX21 and PRKCA show relative decreases in the distal peak (corresponding to the 3′ ends of both canonical and “tail” transcripts) compared to the proximal peak (corresponding to the 3′ end of the “body” fragment) following TEX treatment (1484 transcripts). In total, 65% of the distal peaks are reduced following TEX treatment (p ≤ 4.5e−15 using a paired t-test on distal/proximal ratio), with an average decrease of 22% in the distal peak height following TEX. e Histogram showing the relative change of distal peaks height (3′-end RNA-seq) following and before TEX treatment. f 3′-UTR cleavage occurs post-transcriptionally. RT-qPCR in U2OS cells shows strong TEX sensitivity in the cytoplasmic SLC38A2 “tail” fragment 6 or 9 h following α-amanitin treatment compared to TEX-untreated RNA from α-amanitin-treated cells. g 3′-end RNA-seq of STX16 in control, following α-amanitin; TEX treatment; and both α-amanitin and TEX, show an increase in proximal peak. h Same as e, for α-amanitin-treated cells for 9 h, after and before TEX treatment (p ≤ 1.8e−17, paired t-test). i Histogram of distances between predicted cleavage sites (HMM model using TEX data) and nearest 3′-end RNA-seq peak (in 5619 transcripts). **p < 0.01 and ***p < 0.001 (two-tailed Student’s t-test). Results are representative of three independent experiments with triplicates (b, c, and f). Error bars (b, c, and f), s.d.
Fig. 4
Fig. 4
Body and tail regions of cleaved transcripts are independently regulated by miRNAs. HEK-293 cells were transfected with synthetic miR-92a-3p or with a control double-stranded RNA (dsRNA), and total RNA was extracted 40 h after transfection. a Outline of experiment and data analysis. b Simplified depiction of expected results: down-regulation of transcripts with body miRNA binding sites, independent of their tails. c Cumulative frequency distributions of expression changes in transcripts with 7-mer seed binding sites in the body. X-axis corresponds to log2 of expression fold change (log2(FC)). Comparison was conducted by a two-sided Kolmogorov–Smirnov test. d Normalized RNA-seq read counts from the control, TEX-treated RNA, and miR-92a-transfected cells for CLIC4 (top) and FAM199X (bottom). Predicted cleavage sites and miR-92a 7-mer seed sites in their body region are shown (arrows). e Histograms of log2 fold change differences in body vs. tail regions (purple) in transcripts with predicted cleavage site; or between coding sequence (CDS) vs. 3′-UTR (light green) in transcripts without predicted cleavage site; and the overlap between them (dark purple). In all transcripts, a miR-92a binding site was located exclusively in either body/CDS region, or in tail/3′-UTR region. f Body/tail distinction identifies additional miRNA targets. Number of transcripts with statistically significant decrease in expression following miRNA overexpression based on the custom annotations (blue) and based on the conventional whole transcript annotation (green). Transcripts contain a 7-mer binding site in the body region. (Bottom) A scatter plot of the mean normalized counts of transcripts and their log2 fold change by the body–tail annotation (blue plots) and by the conventional whole transcript annotation (green plot)

References

    1. Hoffman Y, et al. 3′UTR shortening potentiates microRNA-based repression of pro-differentiation genes in proliferating human cells. PLoS Genet. 2016;12:e1005879. doi: 10.1371/journal.pgen.1005879. - DOI - PMC - PubMed
    1. Berkovits BD, Mayr C. Alternative 3′ UTRs act as scaffolds to regulate membrane protein localization. Nature. 2015;522:363–367. doi: 10.1038/nature14321. - DOI - PMC - PubMed
    1. Akman HB, Oyken M, Tuncer T, Can T, Erson-Bensan AE. 3′UTR shortening and EGF signaling: implications for breast cancer. Hum. Mol. Genet. 2015;24:6910–6920. - PubMed
    1. Elkon R, Ugalde AP, Agami R. Alternative cleavage and polyadenylation: extent, regulation and function. Nat. Rev. Genet. 2013;14:496–506. doi: 10.1038/nrg3482. - DOI - PubMed
    1. Lai DP, et al. Genome-wide profiling of polyadenylation sites reveals a link between selective polyadenylation and cancer metastasis. Hum. Mol. Genet. 2015;24:3410–3417. doi: 10.1093/hmg/ddv089. - DOI - PubMed

Publication types