. 2017 Dec 11;8(1):2026.
doi: 10.1038/s41467-017-02245-1.

Loss of PBRM1 rescues VHL dependent replication stress to promote renal carcinogenesis

Affiliations

Loss of PBRM1 rescues VHL dependent replication stress to promote renal carcinogenesis

Judit Espana-Agusti et al. Nat Commun. .

Abstract

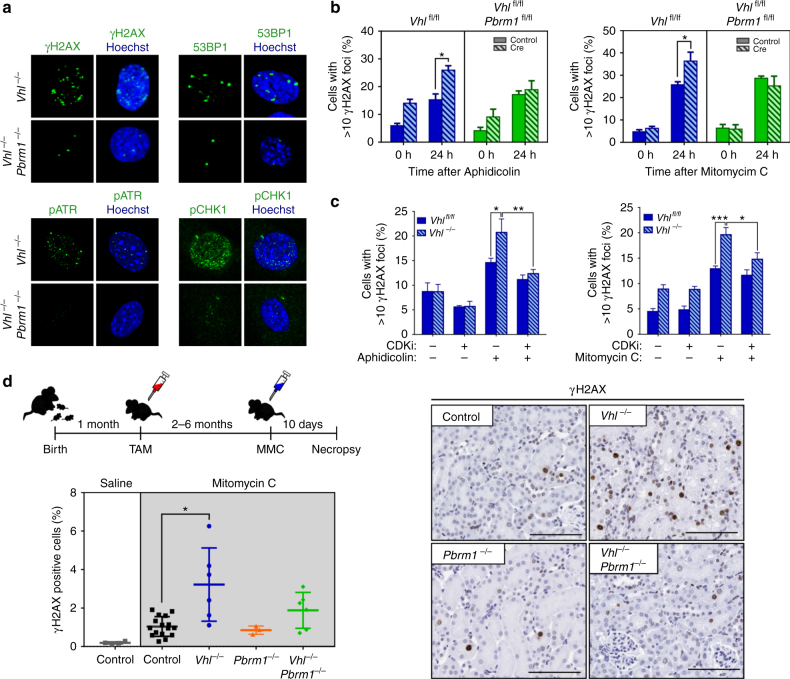
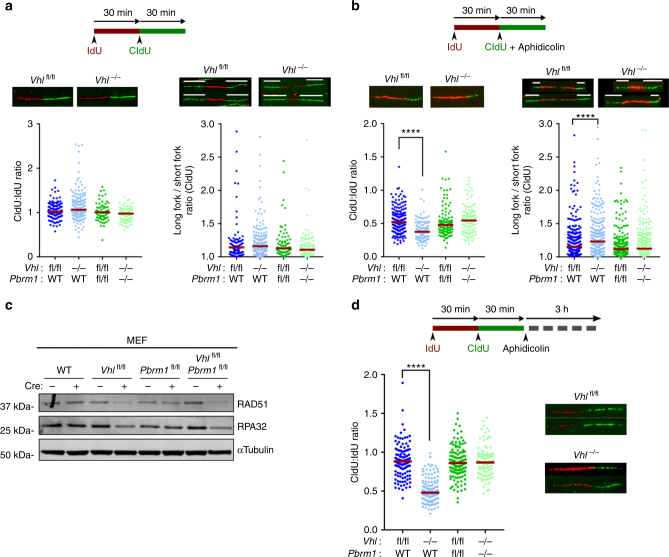
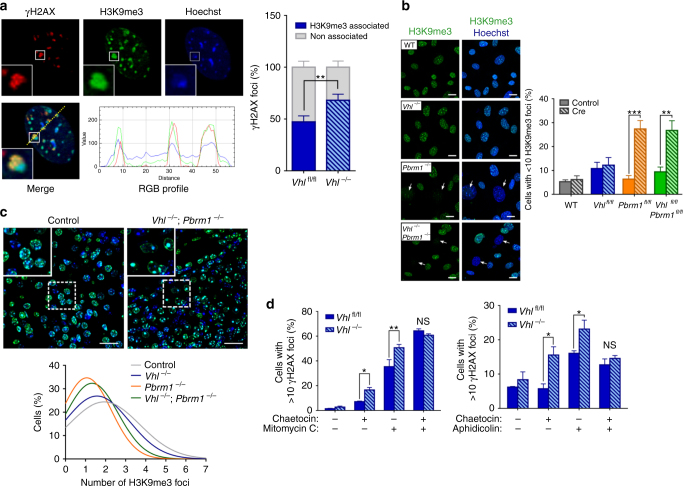
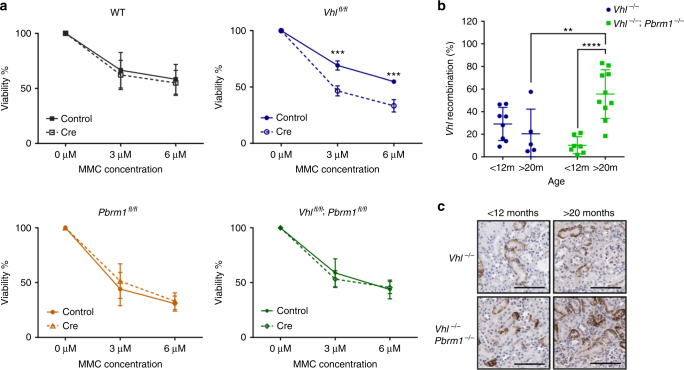
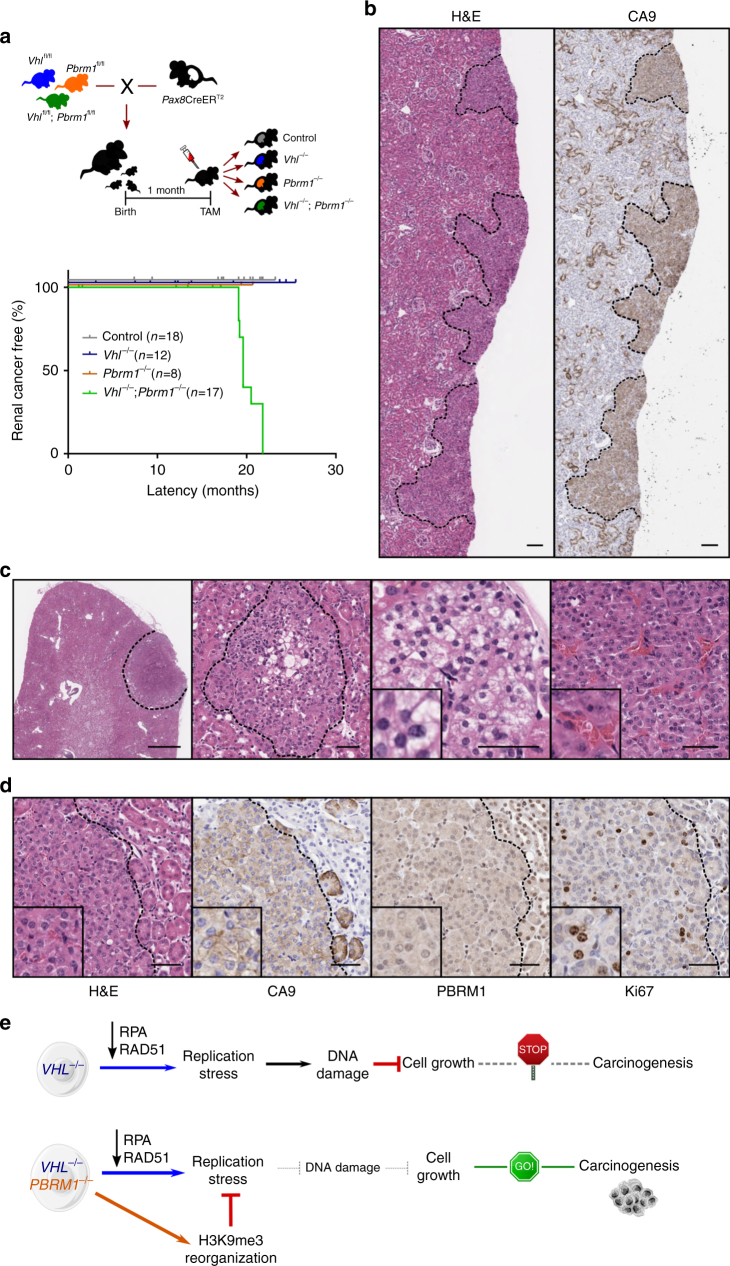
Inactivation of the VHL (Von Hippel Lindau) tumour suppressor has long been recognised as necessary for the pathogenesis of clear cell renal cancer (ccRCC); however, the molecular mechanisms underlying transformation and the requirement for additional genetic hits remain unclear. Here, we show that loss of VHL alone results in DNA replication stress and damage accumulation, effects that constrain cellular growth and transformation. By contrast, concomitant loss of the chromatin remodelling factor PBRM1 (mutated in 40% of ccRCC) rescues VHL-induced replication stress, maintaining cellular fitness and allowing proliferation. In line with these data we demonstrate that combined deletion of Vhl and Pbrm1 in the mouse kidney is sufficient for the development of fully-penetrant, multifocal carcinomas, closely mimicking human ccRCC. Our results illustrate how VHL and PBRM1 co-operate to drive renal transformation and uncover replication stress as an underlying vulnerability of all VHL mutated renal cancers that could be therapeutically exploited.


Conflict of interest statement

J.E.A and A.M are currently paid employees of AstraZeneca. The remaining authors declare no competing financial interests.

Figures

Fig. 1
Fig. 1
Loss of VHL induces replication stress rescued by concomitant loss of PBRM1. a Representative photos of immunofluorescence staining in day 20 recombined MEFs. b, c Quantification of γH2AX foci formation following treatment of MEFs as indicated (b, n (independent experiments) = 3; c, left, n (independent experiments) = 6; right, n (independent experiments) = 4). d Schematic of experimental design of in vivo Mitomycin C (MMC) experiment; renal γH2AX quantification following MMC and representative immunohistochemical photos (n (mice); Saline: control = 6; MMC: control = 16; Vhl −/− = 6; Pbrm1 −/− = 3; Vhl −/− ;Pbrm1 −/− = 7). TAM: tamoxifen. Scale bars, 100 μm. b, c Graphs depict means ± s.e.m. (error bars); two-way ANOVA, Sidak’s correction. d, Graph depicts means ± s.d. (error bars); Kruskall–Wallis, Dunn’s correction. ***p < 0.001, **p < 0.01, *p < 0.05
Fig. 2
Fig. 2
Loss of VHL induces replication fork stalling and collapse. a, b DNA fibre analyses following the indicated treatments. Top: DNA fibre assay experimental design. Bottom left: Representative images of labelled replication tracts and dot plot of CIdU:IdU track ratio in MEFs of indicated genotype (data from representative experiment; n > 85 tracts analysed for each genotype per experiment, n (independent experiments) = 3). Bottom right: Representative images of replication forks (white tracts indicate the lengths of the bidirectional forks analysed) and quantification of replication fork asymmetry (n > 50 forks in total per genotype, data pooled from n (independent experiments) = 3). c Representative immunoblots of MEFs. d Top: Experimental design of fork protection assay. Bottom left: Dot plot of of CIdU:IdU track ratio in MEFs (data from representative experiment, n > 220 tracts analysed for each genotype per experiment, n (independent experiments) = 3). Bottom right: Representative images of labelled replication tracts. a, b, d Median values shown in red; Kruskall–Wallis, Dunnet’s correction ****p < 0.0001
Fig. 3
Fig. 3
PBRM1 loss reorganises H3K9me3-marked heterochromatin to reverse VHL-induced replication stress. a Left: representative images of immunofluorescence staining of γH2AX and H3K9me3 in Vhl-deleted MEFs (Vhl −/−) at 24 h after Mitomycin C. Line scans of γH2AX, H3K9me3 and Hoechst signal intensity are presented in the panels below. Right: quantification of γH2AX and H3K9me3 foci association (n (independent experiments) = 3). b Left: representative images of H3K9me3 immunofluorescence in day 8 MEFs. Arrows indicate cells with indistinct H3K9me3 foci. Scale bars, 20 μm. Right: Quantification of H3K9me3 foci (n (independent experiments) = 5). c H3K9me3 immunofluorescence in the kidneys of control and mutant mice. Representative images are shown in the top panels and histogram distributions of the number of H3K9me3 foci per cell are shown in the bottom (n = 4 mice per genotype; at least 6000 cells analysed per animal). Scale bars, 100 μm. d Quantification of γH2AX foci formation at 24 h following treatment of MEFs as indicated (n (independent experiments) = 3). Graphs depict mean ± s.e.m. (error bars). (a, d) Two-tailed paired t-test. (b) Two-way ANOVA, Sidak’s correction. ***P < 0.001; **P < 0.01; *P < 0.05; NS not significant
Fig. 4
Fig. 4
Combined loss of VHL and PBRM1 improves cellular fitness. a MEF viability at 6 days following exposure to Mitomycin C (n (independent experiments) = 4). b qPCR analysis of the recombined Vhl allele present in renal cortical cells of tamoxifen treated Vhl fl/fl (Vhl −/−) and Vhl fl/fl;Pbrm1 fl/fl (Vhl −/−;Pbrm1 −/−), (Vhl −/−: n = 8 mice <12 m; 5 mice >20 m. Vhl −/−;Pbrm1 −/−: n = 7 < 12 mice, 10 mice >20 m). c Representative images of CA9 immunohistochemistry of Vhl −/− and Vhl −/−;Pbrm1 −/− mice at indicated ages. Graphs depict mean ± s.e.m. (error bars). (a) Two-way ANOVA, Sidak’s correction. (b) Two-way ANOVA, Tukey’s correction. ****P < 0.0001; ***P < 0.001; **P < 0.01
Fig. 5
Fig. 5
Combined loss of Vhl and Pbrm1 is sufficient to initiate renal carcinogenesis. a Top: schematic of crossings, tamoxifen (TAM) administration and resulting cohorts. Bottom: Kaplan–Meier renal cancer-free survival of control and mutant mice. b Representative Haematoxylin and Eosin (H&E) and CA9 immunohistochemistry (IHC) images of serial renal sections from a Vhl −/−;Pbrm1 −/− mouse. Scale bars, 100 μm. c Representative H&E sections of renal neoplasias from Vhl −/−;Pbrm1 −/− mice demonstrating cytoplasmic clearing (middle panels) and prominent thin-walled vasculature (right panel). Scale bar in left panel, 1 mm. Other scale bars, 50 μm. d Images of serial sections of a representative renal tumour from a Vhl −/− ;Pbrm1 −/− mouse stained with H&E or following immunohistochemical analyses with the indicated antibodies. Scale bars, 50 μm. e Schematic interpretation of the effects of VHL loss alone or in combination with PBRM1 and their contributions to renal transformation

Similar articles

Cited by

References

    1. Ferlay, J. et al. GLOBOCAN 2012 v1.0, Cancer Incidence and Mortality Worldwide: IARC CancerBase No. 11, http://globocan.iarc.fr (2013).
    1. Motzer RJ, Hutson TE, McCann L, Deen K, Choueiri TK. Overall survival in renal-cell carcinoma with pazopanib versus sunitinib. N. Engl. J. Med. 2014;370:1769–1770. doi: 10.1056/NEJMc1400731. - DOI - PubMed
    1. Gossage L, Eisen T, Maher ER. VHL, the story of a tumour suppressor gene. Nat. Rev. Cancer. 2015;15:55–64. doi: 10.1038/nrc3844. - DOI - PubMed
    1. Latif F, et al. Identification of the von Hippel-Lindau disease tumor suppressor gene. Science. 1993;260:1317–1320. doi: 10.1126/science.8493574. - DOI - PubMed
    1. Gnarra JR, et al. Mutations of the VHL tumour suppressor gene in renal carcinoma. Nat. Genet. 1994;7:85–90. doi: 10.1038/ng0594-85. - DOI - PubMed

Publication types

MeSH terms

LinkOut - more resources