. 2017 Dec 11;8(1):2045.
doi: 10.1038/s41467-017-02305-6.

Single-cell RNA-sequencing uncovers transcriptional states and fate decisions in haematopoiesis

Affiliations

Single-cell RNA-sequencing uncovers transcriptional states and fate decisions in haematopoiesis

Emmanouil I Athanasiadis et al. Nat Commun. .

Abstract

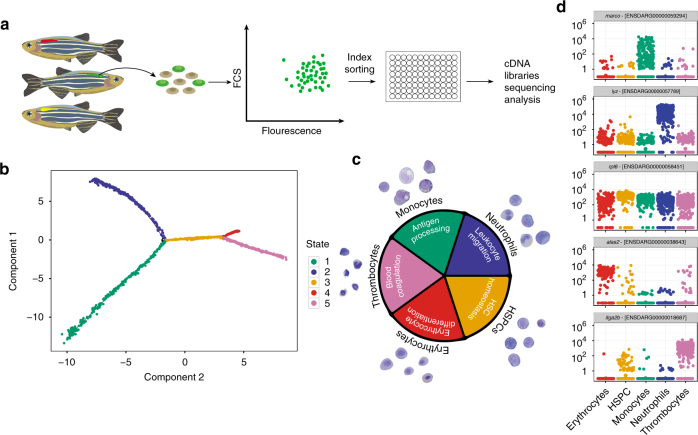
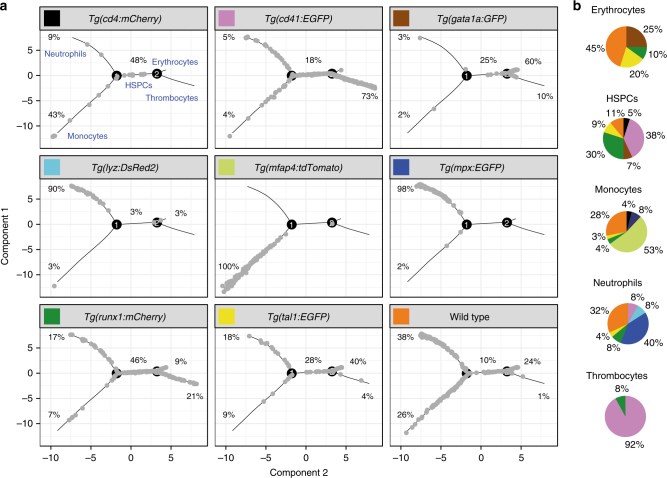
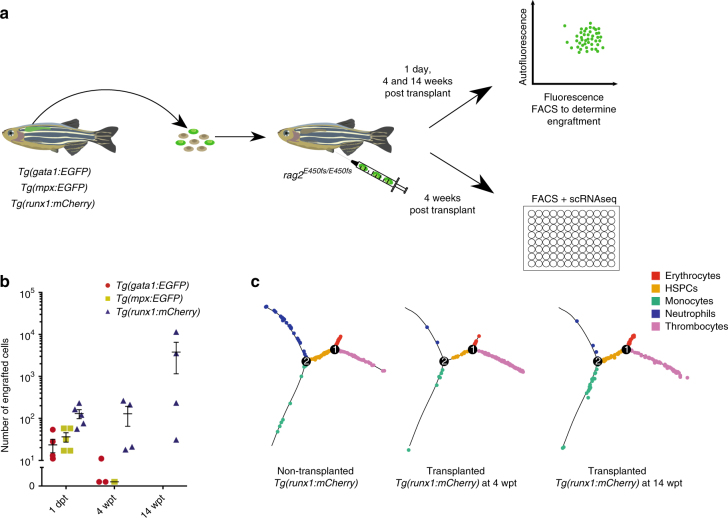
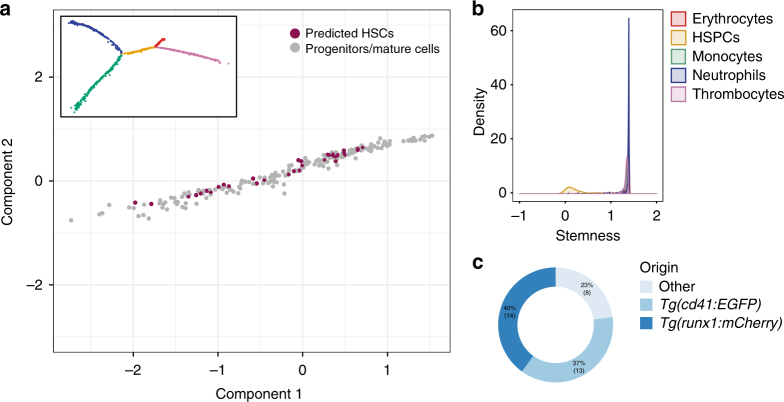
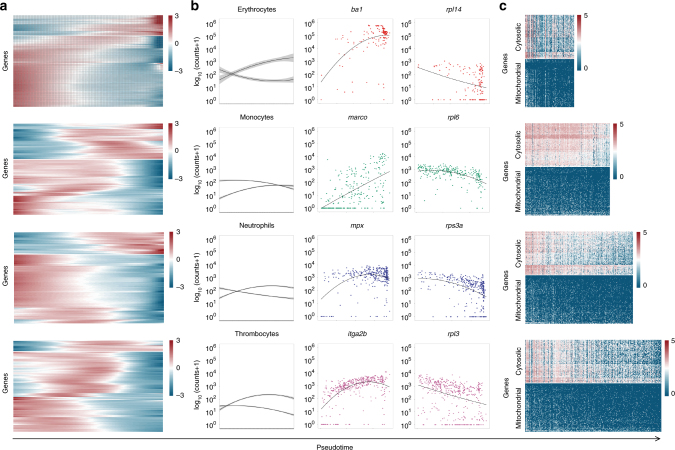
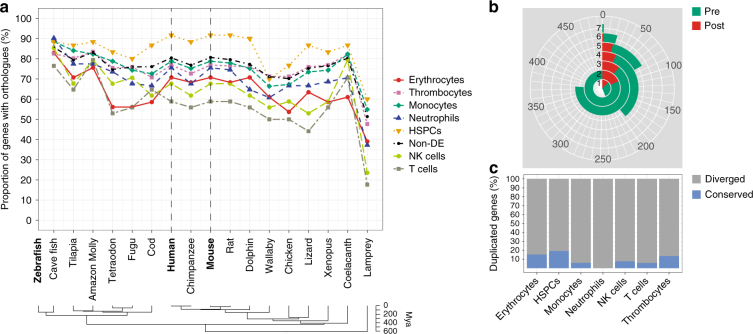
The success of marker-based approaches for dissecting haematopoiesis in mouse and human is reliant on the presence of well-defined cell surface markers specific for diverse progenitor populations. An inherent problem with this approach is that the presence of specific cell surface markers does not directly reflect the transcriptional state of a cell. Here, we used a marker-free approach to computationally reconstruct the blood lineage tree in zebrafish and order cells along their differentiation trajectory, based on their global transcriptional differences. Within the population of transcriptionally similar stem and progenitor cells, our analysis reveals considerable cell-to-cell differences in their probability to transition to another committed state. Once fate decision is executed, the suppression of transcription of ribosomal genes and upregulation of lineage-specific factors coordinately controls lineage differentiation. Evolutionary analysis further demonstrates that this haematopoietic programme is highly conserved between zebrafish and higher vertebrates.


Conflict of interest statement

The authors declare no competing financial interests.

Figures

Fig. 1
Fig. 1
Pseudotime ordering reveals a gradual transition of cells from immature to more differentiated within the myeloid branch. a Experimental strategy for sorting single cells from transgenic zebrafish lines. Cells were collected from a single kidney of each line and sorted for expression of the fluorescent transgene. Index sorting was used to dispense single cells into a 96-well plate and these were subsequently processed for RNA-seq analyses. b Five cell states were predicted using the Monocle2 algorithm for temporal analyses of single-cell transcriptomes. c Analysis of genes that are differentially expressed across the five states (given the same colour code used in b) reveals GO terms (inner circle) that are highly pertinent to specific cell types. The outer circle shows examples of May–Grünwald Giemsa-stained cells from kidneys of transgenic lines that largely label each particular cell type. d Jitter plots showing the expression (y axis) of differentially expressed marker genes in each cell type (x axis). Each dot in the jitter plot shows the expression of the gene log10 (counts +1) in each cell
Fig. 2
Fig. 2
The distribution of cells from different transgenic lines modelled by Monocle. a The trajectories of cell states predicted by Monocle are shown in grey for each transgenic line used, with the associated cell types labelled in blue. The percentage of cells from each transgenic line contributing to each state is given next to the relevant trajectory. b Pie charts showing the contribution of transgenic lines to each cell type. The colour code relates to the colours given in the headers for each transgenic line used in a
Fig. 3
Fig. 3
Cells within distinct states have different repopulation potentials. a Experimental strategy for the adult transplantation experiment. Kidneys were dissected from transgenic donor fish and sorted for cells expressing the fluorescent transgene. Positive cells were collected and injected into sublethally irradiated rag2 E450fs−/− fish. b Assessment for engraftment was made 1 day, 4- and 14 weeks post transplantation using flow cytometry. Successfully engrafted fluorescent donor cells were isolated at 4 weeks PI by index sorting single cells into a microtitre plate for subsequent RNA-seq analyses. c Distribution of runx1+ cells, from non-transplanted (left) and transplanted fish at 4 (middle) and 14 wpt (right), modelled by Monocle
Fig. 4
Fig. 4
Transcriptionally similar cells display different probabilities of being stem cells. a Cells predicted to be stem cells in the middle part of the lineage tree according to their stemness index. The insert shows the new Monocle tree including transplanted cells (1724 single cells and 1871 highly variable genes). b Distribution of stemness scores in different branches of the tree showing the presence of potential HSCs exclusively in the HSPC branch. c Contribution of different transgenic lines to predicted stem cells
Fig. 5
Fig. 5
Lineage differentiation is defined by two main trends in gene expression. a Heatmap of genes whose expression changed dynamically during pseudotime in each of the four branches. b Graph showing the average expression pattern of the dynamically expressed genes that follow the same trend across pseudotime. For each of the cell states, one gene is presented that follows one of the two main trends. Standard error is shown as a grey area around the trend lines. c Heatmap of expression of 168 genes annotated as 'ribosomal proteins' genes in pseudotime in each of the four branches
Fig. 6
Fig. 6
Conservation analysis of zebrafish genes differentially expressed in the main blood cell types. a Percentage of zebrafish protein-coding genes (specific for distinct blood cell types, as well as non-differentially expressed) with orthologs in other vertebrate species. b The total number of paralogs duplicated exclusively pre- (green) and post-ray-finned speciation (red). The numbers 1–7 mark the number of cell types (erythrocytes, monocytes, neutrophils, thrombocytes, HSPCs, T cells and NK cells) in which the duplicated genes are expressed. c The percentage of conserved vs diverged genes duplicated exclusively post speciation (fish-specific genes)

Similar articles

Cited by

References

    1. Orkin SH, Zon LI. Hematopoiesis: an evolving paradigm for stem cell biology. Cell. 2008;132:631–644. doi: 10.1016/j.cell.2008.01.025. - DOI - PMC - PubMed
    1. Kondo M, Weissman IL, Akashi K. Identification of clonogenic common lymphoid progenitors in mouse bone marrow. Cell. 1997;91:661–672. doi: 10.1016/S0092-8674(00)80453-5. - DOI - PubMed
    1. Akashi K, Traver D, Miyamoto T, Weissman IL. A clonogenic common myeloid progenitor that gives rise to all myeloid lineages. Nature. 2000;404:193–197. doi: 10.1038/35004599. - DOI - PubMed
    1. Adolfsson J, et al. Identification of Flt3+ lympho-myeloid stem cells lacking erythro-megakaryocytic potential a revised road map for adult blood lineage commitment. Cell. 2005;121:295–306. doi: 10.1016/j.cell.2005.02.013. - DOI - PubMed
    1. Månsson R, et al. Molecular evidence for hierarchical transcriptional lineage priming in fetal and adult stem cells and multipotent progenitors. Immunity. 2007;26:407–419. doi: 10.1016/j.immuni.2007.02.013. - DOI - PubMed

Publication types

Substances