. 2018 Jan;50(1):151-158.
doi: 10.1038/s41588-017-0004-9. Epub 2017 Dec 11.

Annotation-free quantification of RNA splicing using LeafCutter

Affiliations

Annotation-free quantification of RNA splicing using LeafCutter

Yang I Li et al. Nat Genet. 2018 Jan.

Abstract

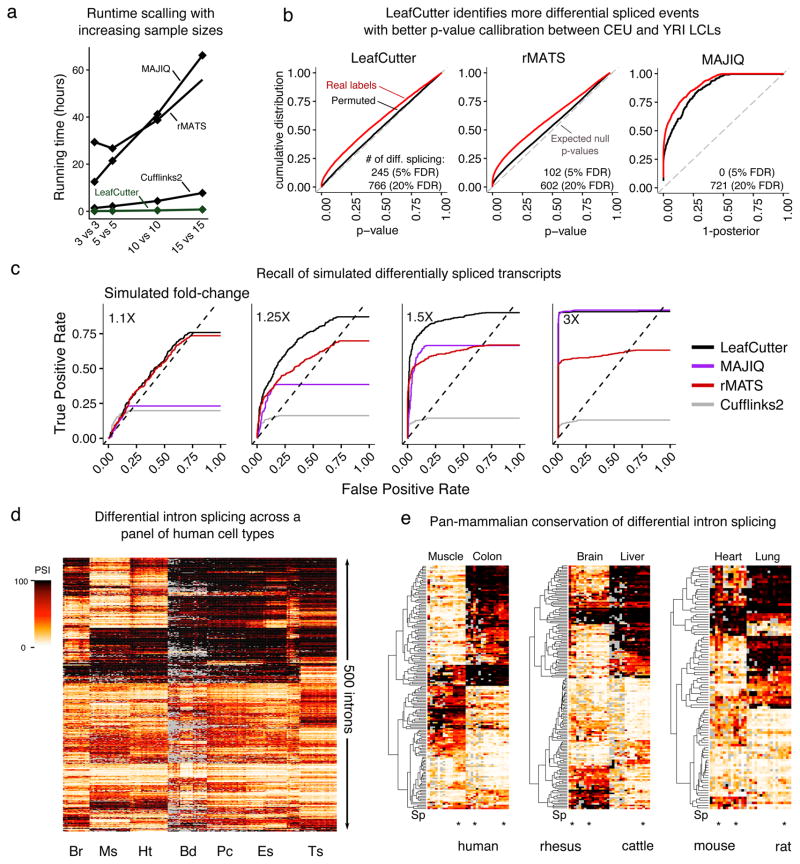
The excision of introns from pre-mRNA is an essential step in mRNA processing. We developed LeafCutter to study sample and population variation in intron splicing. LeafCutter identifies variable splicing events from short-read RNA-seq data and finds events of high complexity. Our approach obviates the need for transcript annotations and circumvents the challenges in estimating relative isoform or exon usage in complex splicing events. LeafCutter can be used both to detect differential splicing between sample groups and to map splicing quantitative trait loci (sQTLs). Compared with contemporary methods, our approach identified 1.4-2.1 times more sQTLs, many of which helped us ascribe molecular effects to disease-associated variants. Transcriptome-wide associations between LeafCutter intron quantifications and 40 complex traits increased the number of associated disease genes at a 5% false discovery rate by an average of 2.1-fold compared with that detected through the use of gene expression levels alone. LeafCutter is fast, scalable, easy to use, and available online.


Conflict of interest statement

Competing Financial Interests Statement

The authors declare no competing financial interests.

Figures

Figure 1
Figure 1
Overview of LeafCutter. (a) LeafCutter uses split reads to uncover alternative choices of intron excision by finding introns that share splice sites. In this example, LeafCutter identifies two clusters of variably excised introns. (b) LeafCutter workflow. First, short reads are mapped to the genome. When SNP data are available, WASP should be used to filter allele-specific reads that map with a bias. Next, LeafCutter extracts junction reads from .bam files, identifies alternatively excised intron clusters, and summarizes intron usage as counts or proportions. Lastly, LeafCutter identifies intron clusters with differentially excised introns between two user-defined groups using a Dirichlet-multinomial model or maps genetic variants associated with intron excision levels using a linear model. (c) Visualization of differential splicing between 10 GTEx heart and brain samples using LeafViz. LeafViz is an interactive browser-based application that allows users to visualize results from LeafCutter differential splicing analyses. In this example, we observed that Rbfox1 shows differential usage of a mutually exclusive exon in heart compared to brain. For all examples, see URLs.
Figure 2
Figure 2
LeafCutter discovers reproducible unannotated introns. (a) Using LeafCutter to discover novel introns, we find that for any given tissue, over 10% of alternatively excised introns are unannotated. Remarkably, 48.5% of testis alternatively excised introns are unannotated. Different colors denote the proportion of introns when one or more splice sites are unannotated “(ss absent)”, both splice sites are annotated but the intron is not part of any transcript “(ss present)”, or when the intron is annotated in some but not all databases. (b) Barplots showing the numbers of unannotated and annotated junctions discovered using LeafCutter that are also found in samples from the short read archive (SRA) using Intropolis. Phenopredict was used to predict the tissue type corresponding to the SRA samples analyzed in Intropolis. (c) The unannotated splice sites of novel introns show moderate signature of sequence conservation as determined by vertebrate phastCons scores. Miss one: conservation of the unannotated splice site of an intron for which the cognate splice site is annotated. Miss both: conservation of splice sites of introns with both splice sites unannotated.
Figure 3
Figure 3
Comparison of methods for detecting differential splicing. (a) Running time of differential splicing methods applied to comparisons between YRI and CEU LCLs RNA-seq samples. (b) Cumulative distributions of differential splicing test p-values (1-posterior for MAJIQ) for the 15 YRI versus 15 CEU LCLs comparison (red). The distribution of test p-values for a comparison with permuted labels is also shown (black). Cufflinks2 (not shown) detected 0 significantly differentially spliced genes (Supplementary Figure 8). (c) Receiver operating characteristic (ROC) curves of LeafCutter, Cufflinks2, rMATS and MAJIQ when evaluating differential splicing of genes with transcripts simulated to have varying levels of differential expression. ROC curves that do not reach 1.00 True Positive Rates reflect genes simulated to be differentially spliced that were not tested. (d) LeafCutter identifies tissue-regulated intron splicing events from GTEx organ samples. Heatmap of the intron excision ratios of the top 500 introns that were found to be differentially spliced between at least one tissue pair. Tissues include brain (Br), muscle (Ms), heart (Ht), blood (Bd), pancreas (Pc), esophagus (Eg), and testis (Ts). (e) Heatmap showing intron exclusion ratios of introns differentially spliced between pairs of tissues (Muscle vs Colon, Brain vs Liver, and heart vs Lung). Heatmap shows 100 random introns (97 for the heart vs lung comparison) that were predicted to be differentially excised in human with p-value < 10−10 (LR-test) and no more than 5 samples with missing data. Heatmap of all introns that pass our criteria can be found in Supplementary Figure 11.
Figure 4
Figure 4
LeafCutter sQTLs augment interpretation of GWAS hits. (a) QQ-plot showing genome-wide sQTL signal in LCLs (black), sQTL signal conditioned on exon eQTLs (purple) and conditioned on transcript ratio QTLs (dark purple) from. Signal from permuted data in light grey shows that the test is well-calibrated. (b) Positional distribution of sQTLs across LeafCutter-defined intron clusters. 1,421 of 4,543 sQTLs lie outside the boundaries (Supplementary Figure 13 for all sQTLs). (c) High proportion of shared sQTLs across four tissues from. (d) Example of a SNP associated to the excision level of an intron in blood but not in other tissues. Boxplot center line: median, box: interquartile range (IQR), whiskers: range of data, excluding outliers beyond 1.5x IQR.
Figure 5
Figure 5
LeafCutter sQTLs enable interpret disease-variants. (a) Enrichment of low p-value associations to multiple sclerosis and rheumatoid arthritis among LeafCutter sQTL and GEUVADIS eQTL SNPs. The numbers of top sQTLs and eQTLs that are tested in each GWAS are shown in parentheses. (b) Manhattan plot of S-PrediXcan association p-values from prediction models for intron quantification (LeafCutter; top) and gene expression (GEUVADIS; bottom). Genes that were found to be associated through RNA splicing are highlighted in orange, those associated through gene expression in purple, and those associated through both in black. The names of associated genes from the extended MHC region are not shown.

References

    1. Han H, et al. MBNL proteins repress ES-cell-specific alternative splicing and reprogramming. Nature. 2013;498:241–245. - PMC - PubMed
    1. Calarco JA, et al. Regulation of vertebrate nervous system alternative splicing and development by an SR-related protein. Cell. 2009;138:898–910. - PubMed
    1. Brett D, Pospisil H, Valcarcel J, Reich J, Bork P. Alternative splicing and genome complexity. Nat Genet. 2002;30:29–30. - PubMed
    1. Pai AA, et al. Widespread Shortening of 3′ Untranslated Regions and Increased Exon Inclusion Are Evolutionarily Conserved Features of Innate Immune Responses to Infection. PLoS Genet. 2016;12:e1006338. - PMC - PubMed
    1. Trapnell C, et al. Differential analysis of gene regulation at transcript resolution with RNA-seq. Nat Biotechnol. 2013;31:46–53. - PMC - PubMed

Methods-only References

    1. Dobin A, et al. STAR: ultrafast universal RNA-seq aligner. Bioinformatics. 2013;29:15–21. - PMC - PubMed
    1. Gamazon ER, et al. A gene-based association method for mapping traits using reference transcriptome data. Nature genetics. 2015;47:1091–1098. - PMC - PubMed
    1. Wheeler HE, et al. Survey of the Heritability and Sparse Architecture of Gene Expression Traits across Human Tissues. PLoS Genet. 2016;12:e1006423. - PMC - PubMed

Publication types