. 2018 May;25(5):885-903.
doi: 10.1038/s41418-017-0021-3. Epub 2017 Dec 11.

Snail mediates crosstalk between TGFβ and LXRα in hepatocellular carcinoma

Affiliations

Snail mediates crosstalk between TGFβ and LXRα in hepatocellular carcinoma

Claudia Bellomo et al. Cell Death Differ. 2018 May.

Abstract

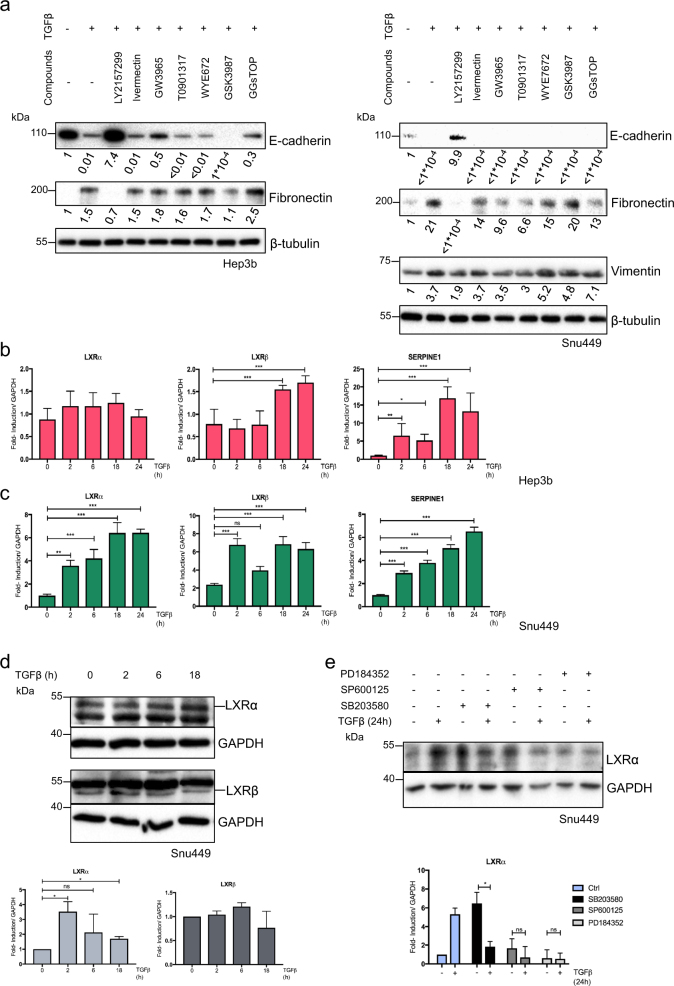
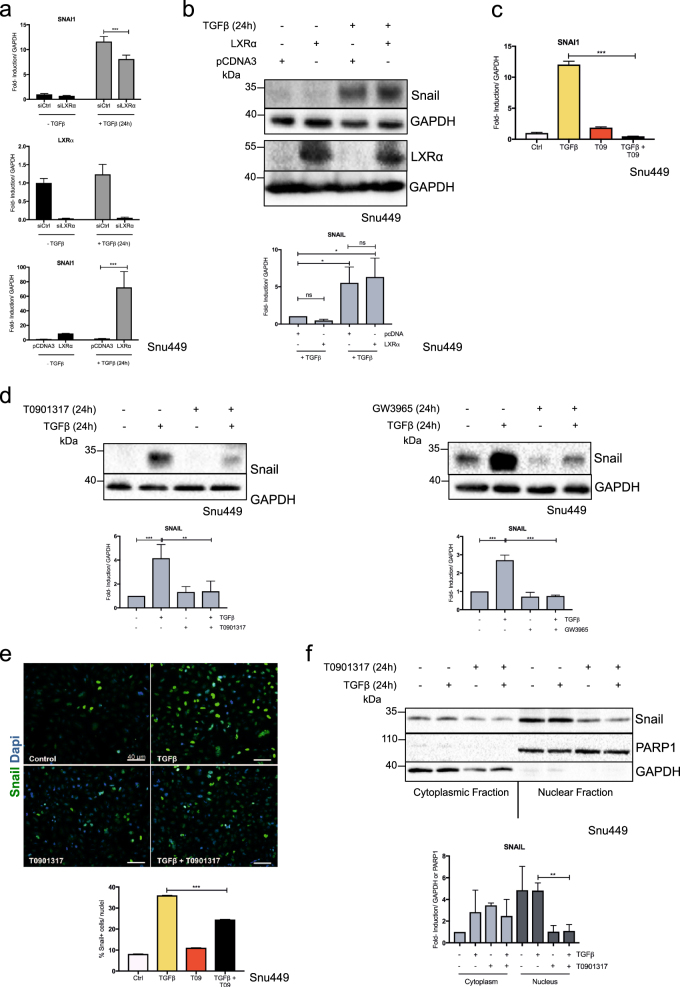
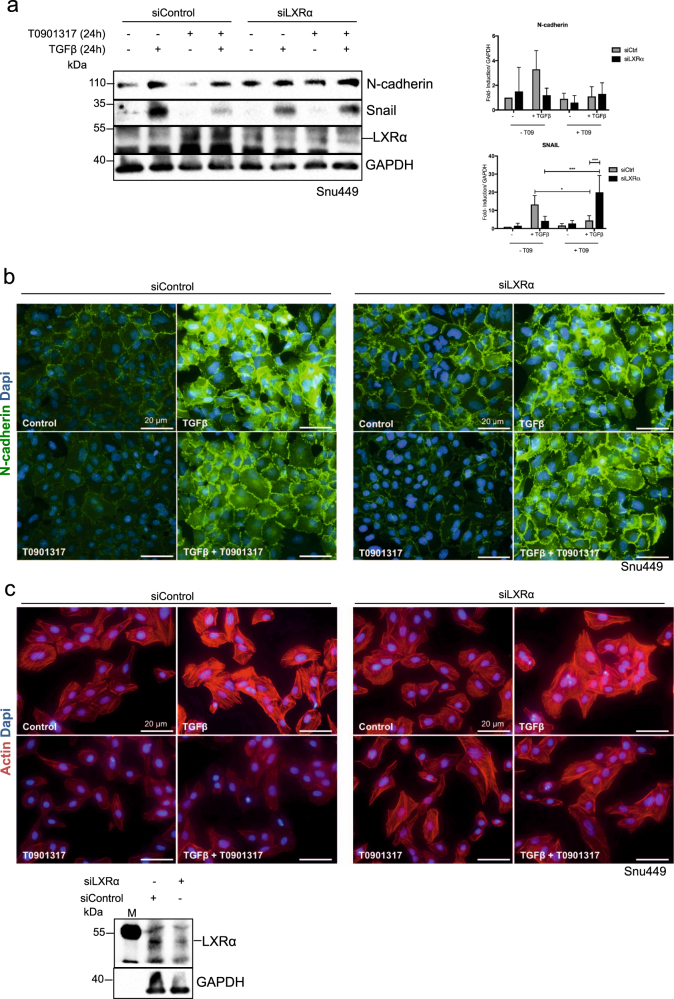
Understanding the complexity of changes in differentiation and cell survival in hepatocellular carcinoma (HCC) is essential for the design of new diagnostic tools and therapeutic modalities. In this context, we have analyzed the crosstalk between transforming growth factor β (TGFβ) and liver X receptor α (LXRα) pathways. TGFβ is known to promote cytostatic and pro-apoptotic responses in HCC, and to facilitate mesenchymal differentiation. We here demonstrate that stimulation of the nuclear LXRα receptor system by physiological and clinically useful agonists controls the HCC response to TGFβ. Specifically, LXRα activation antagonizes the mesenchymal, reactive oxygen species and pro-apoptotic responses to TGFβ and the mesenchymal transcription factor Snail mediates this crosstalk. In contrast, LXRα activation and TGFβ cooperate in enforcing cytostasis in HCC, which preserves their epithelial features. LXRα influences Snail expression transcriptionally, acting on the Snail promoter. These findings propose that clinically used LXR agonists may find further application to the treatment of aggressive, mesenchymal HCCs, whose progression is chronically dependent on autocrine or paracrine TGFβ.


Conflict of interest statement

The authors declare that they have no conflict of interests.

Figures

Fig. 1
Fig. 1. TGFβ regulates LXRα expression in the mesenchymal cell line Snu449
a Hep3B (left) and Snu449 (right) cells were treated with the indicated compounds (10 μM) and TGFβ1 (5 ng/ml) for 24 h. The TGFβ type I receptor kinase inhibitor LY2157299 was added at a final concentration of 2 μM for 24 h as a potent positive control. The expression of the indicated proteins was analyzed by immunoblotting. Experiments performed in biological duplicate. Densitometric quantification is provided below each lane. Results indicated as <0.01 represent a densitometric intensity between 0.0045 and 0.0082; results indicated as <1 × 10−4 mean a densitometric intensity between 0.00002 and 0.00009; basal expression levels set as 1 correspond to either strong detectable protein levels (E-cadherin) or very low to almost undetectable levels (fibronectin). b, c Hep3B (b) and Snu449 (c) cells were treated for different time periods with TGFβ1 (5 ng/ml). The expression of LXRα, LXRβ, and SERPINE1/PAI1 genes was assessed via real-time PCR and normalized to the expression of GAPDH. Mean ± SD values are plotted, and basal expression levels set to 1 correspond to different absolute levels of expression for each mRNA. Experiments performed in biological triplicate, each of them in technical triplicate. d Snu449 cells were treated with TGFβ1 (5 ng/ml) for the indicated time periods. The expression of the indicated proteins was analyzed by immunoblotting. Experiments performed in biological triplicate. Densitometric quantification is provided graphically, and basal expression levels set to 1 correspond to different absolute levels of expression for each LXR member. e Snu449 cells were treated with vehicle or TGFβ1 (5 ng/ml) for 24 h. SB203580 (p38 inhibitor, 10 µM), SP600125 (JNK inhibitor, 10 µM), and PD184352 (MEK inhibitor, 0.5 µM) were added 1 h prior to TGFβ1 addition. The expression of the indicated proteins was visualized via immunoblotting. Experiments performed in biological triplicate. Densitometric quantification is provided graphically. Statistical significance was assessed by one-way (bd) or two-way (e) Anova. Significance was assigned as *p < 0.05, **p < 0.01, ***p < 0.001. All immunoblots indicate molecular size markers in kDa
Fig. 2
Fig. 2. LXRα activation antagonizes TGFβ-induced Snail expression
a Snu449 cells were transfected with 30 nM of non-targeting siRNA control or LXRα targeting siRNAs and stimulated by TGFβ1 (5 ng/ml) for 24 h in starvation medium. Expression of the indicated genes was assessed by real-time PCR. Mean ± SD values are plotted, and basal expression levels set to 1 correspond to the same absolute levels of SNAI1 mRNA expression. Experiments performed in biological duplicate, each of them in technical triplicate. b Snu449 were transfected with 1 μg of pCDNA3 or pCMX-LXRα plasmid, and treated with TGFβ1 (5 ng/ml) for 24 h in starvation medium. Expression of the indicated proteins was assessed by immunoblotting. Experiments performed in biological triplicate. Densitometric quantification is provided graphically, and basal expression levels set to 1 correspond to different absolute levels of protein expression, as visualized on the immunoblots. c Snu449 cells were treated with TGFβ1 (5 ng/ml) with or without T0901317 (5 μM) in starvation medium for 24 h; expression of SNAI1 mRNA was assessed by real-time PCR. Mean ± SD values are plotted. Experiments performed in biological triplicate, each of them in technical triplicate. d Snu449 cells were treated in starvation medium for 24 h; TGFβ1 (5 ng/ml) was administered with or without LXR agonist (T0901317 or GW3965, 5 μM). Expression of Snail was determined by immunoblotting. Experiments performed in biological quadruplicate. Densitometric quantification is provided graphically, and basal expression level set to 1 corresponds to almost undetectable absolute level of Snail expression, as visualized on the immunoblot. e Snu449 cells were immunostained for Snail and DAPI after 3 h of the indicated treatments. Snail is represented in green, DAPI staining in blue. Bars represent 40 µm. Quantification of the percent of Snail-positive nuclei is graphed as mean ± SD values. Experiments performed in biological triplicate. f Snu449 cells were starved and treated as specified. Nuclear fractionation assay was performed and abundance of the indicated proteins was assessed by immunoblotting. Experiments performed in biological duplicate. Densitometric quantification is provided graphically, and basal expression levels set to 1 correspond to the cytoplasmic levels of Snail protein expression, as visualized on the immunoblot. Statistical significance was assessed by two-way (a, b) or one-way (cf) Anova. Significance was assigned as *p < 0.05, **p < 0.01, ***p < 0.001. All immunoblots indicate molecular size markers in kDa
Fig. 3
Fig. 3. The antagonistic effect of LXRα with regard to TGFβ-induced Snail expression occurs at the promoter level
a HepG2 cells were simultaneously transfected for 48 h with ABCA1-luc reporter, β-gal plasmid, and siControl non-targeting or siLXRα targeting siRNA at a final concentration of 30 nM (upper graph) or empty vector pCDNA3, pCDNA3-LXRα full length, or pCDNA3-LXRα trunc (bottom graph). Cells were treated in starvation medium with T0901317 (T09, 5 μM) for 24 h, prior to luciferase and β-galactosidase activity detection. Mean ± SD of normalized activity values are plotted, and activity levels set to 1 correspond to the mock (siCtrl or pCDNA3) condition in the presence of DMSO (vehicle), which exhibited different absolute activity levels. Experiments performed in biological triplicate, each of them in technical quadruplicate. Immunoblotting for detection of MYC-tagged LXRα full length or MYC-LXRα trunc together with GAPDH is provided as control. b HepG2 cells were simultaneously transfected with a siControl non-targeting or siLXRα targeting siRNA at a final concentration of 30 nM and b pCDNA3 or pCMX-LXRα and Snail-luciferase reporter plasmids for 48 h prior to luciferase and β-galactosidase activity analysis. Mean ± SD of normalized activity values are plotted, and activity levels set to 1 correspond to the mock (siCtrl or pCDNA3) condition, which exhibited different absolute activity levels. Experiments performed in biological triplicate, each of them in technical triplicate. c HepG2 cells were transfected with pCDNA3 or pCMX-LXRα plasmids and Snail-luciferase reporter for 48 h, then treated in starvation medium with TGFβ1 (5 ng/ml) with or without T0901317 (T09, 5 μM) for 24 h, prior to luciferase and β-galactoside activity detection. Mean ± SD of normalized activity values are plotted, and activity levels set to 1 correspond to the mock (pCDNA3) condition in the presence of DMSO (vehicle). Transfected proteins were visualized by immunoblotting. Experiments performed in biological duplicate, each of them in technical quadruplicate. d HepG2 cells were transfected with pFlag-Smad3 and -Smad4 and Snail-luciferase reporter plasmids, then cells were treated with T0901317 (T09, 5 µM) for 24 h prior to luciferase and β-galactosidase activity assessment. Mean ± SD of normalized activity values are plotted, and activity levels set to 1 correspond to the mock (pCDNA3) condition in the presence of DMSO (vehicle). Experiments performed in biological triplicate, each of them in technical triplicate. Immunoblotting for detection of Smad3 is provided as control. All immunoblots indicate molecular size markers in kDa. Statistical significance was assessed by two-way (a, c), one-way (d) Anova, or unpaired T-test (b). Significance was assigned as **p < 0.01, ***p < 0.001
Fig. 4
Fig. 4. The antagonistic role of LXRα on TGFβ and Snail negatively influences the mesenchymal properties of Snu449 cells
Snu449 cells were treated with TGFβ1 (5 ng/ml) with or without LXR agonist (T0901317 or GW3965, 5 μM) in starvation medium for 24 h. a, b The expression of the indicated proteins was assessed by immunoblotting. All immunoblots indicate molecular size markers in kDa. Experiments performed in biological quadruplicate. Densitometric quantification is provided graphically and basal expression levels set to 1 correspond to the different levels of N-cadherin protein expression, as visualized on the immunoblots. Statistical significance was assessed by one-way Anova and was assigned as *p < 0.05, **p < 0.01, ***p < 0.001. c, d Representative images of N-cadherin (green, c) immunofluorescence or phalloidin staining shown to visualize F-actin (red, d) cellular localization, with DAPI staining in blue. Bars represent 20 µm. Experiments performed in biological triplicate
Fig. 5
Fig. 5. The antagonistic effect of T0901317 on mesenchymal properties depends on an active LXRα pathway
Snu449 cells were transfected with non-targeting siControl and siLXRα targeting siRNA for 24 h and treated with TGFβ1 (5 ng/ml) with or without T0901317 (5 μM) in starvation medium for 24 h. a The expression of the indicated proteins was assessed by immunoblotting. Experiments performed in biological quadruplicate. Densitometric quantification is provided graphically and basal expression levels set to 1 correspond to different levels of N-cadherin and Snail protein expression, as visualized on the immunoblots. Statistical significance was assessed by two-way Anova and was assigned as *p < 0.05, ***p < 0.001. b, c Representative images of N-cadherin (green, b) immunofluorescence or phalloidin staining to visualize F-actin (red) cellular localization, with DAPI staining in blue. Bars represent 20 µm. Experiments performed in biological triplicate. All immunoblots indicate molecular size markers in kDa; M stands for the molecular size marker lane
Fig. 6
Fig. 6. TGFβ and LXRα additively suppress the proliferation of the epithelial Hep3B cells
Hep3B cells were treated with TGFβ1 (5 ng/ml) with or without T0901317 (5 μM) in starvation medium. a Hep3B cells were treated for 48 h and subsequently MTS viability assay was performed. The graph describes the percentage of cell viability related to untreated cells, which is set to 100%, and values are mean ± SD values. Experiments performed in biological triplicate, each of them in technical triplicate. b Hep3B cells were treated for 24 h, and immunofluorescence staining for Ki67 was performed. Representative image where Ki67 is represented in green, DAPI staining in blue. Bars represent 20 µm. The percentage of Ki67-positive nuclei is graphed as mean ± SD values, for each condition. Experiments performed in biological triplicate. c Hep3B cells were treated for 24 h, the expression of the indicated proteins was assessed by immunoblotting. Experiments performed in biological triplicate. Densitometric quantification is provided graphically and basal expression levels set to 1 correspond to the different absolute levels of cyclin E and p21 protein expression, as visualized on the immunoblots. Statistical significance was assessed by one-way Anova. Significance was assigned as *p < 0.05,   ***p < 0.001. All immunoblots indicate molecular size markers in kDa
Fig. 7
Fig. 7. LXRα signaling negatively affects TGFβ induction of early and late apoptosis in Hep3B and Snu449, while inducing pro-survival genes in Hep3B cells
Cells were treated with TGFβ1 (5 ng/ml) with or without T0901317 (5 μM) in starvation medium. a Hep3B cells were treated for 24 h and subsequently stained with propidium iodide (PI), a late apoptosis detection assay. Representative pictures are shown with PI-positive cells (red). Bars represent 60 µm. Quantification of percentage of PI-positive nuclei is graphed as mean ± SD values. Experiments performed in biological triplicate, each of them in technical duplicate. b Hep3B cells (left) and Snu449 cells (right) were treated as described in the methods for 16 h and subsequently the caspase 3 cleavage assay was performed, indicative of early apoptosis events. Quantification of caspase activity normalized to protein content per time unit is graphed as mean ± SD values. Experiments performed in biological triplicate, each of them in technical duplicate. c Hep3B cells were treated for 24 h, the expression of the indicated proteins was assessed by immunoblotting. Experiments performed in biological triplicate. Densitometric quantification is provided graphically, and basal expression levels set to 1 correspond to the levels of pAKT protein in the presence of vehicle treatment, as visualized on the immunoblot. All immunoblots indicate molecular size markers in kDa. d Hep3B cells were treated in starvation medium for 16 h, as described in the methods. The expression of the indicated genes was assessed via real-time PCR and is graphed as mean ± SD values, and basal expression levels set to 1 correspond to different absolute levels of BCL2 or MCL1 mRNA expression. Experiments performed in biological triplicate, each of them in technical triplicate. e After 4 h of treatment, the total amount of reactive oxygen species was quantified by H2DCFDA fluorimetric quantification. Data are presented as percentage vs. control, which is set to 100%, and are mean ± SD. Experiments performed in biological quadruplicate, each of them in technical duplicate. f Upon 16 h treatment, the expression of NOX4 mRNA was assessed via real-time PCR, and results are shown as mean ± SD. Experiments performed in biological triplicate, each of them in technical triplicate. Statistical significance was assessed by one-way Anova. Significance assigned **p < 0.01, ***p < 0.001
Fig. 8
Fig. 8. Snail regulates the expression of pro-survival genes BCL2 and MCL1
Hep3B cells were transfected with non-targeting siControl and siSnail targeting siRNA at a final concentration of 30 nM for 24 h and subsequently seeded for the specified experiments, then cells were treated with TGFβ1 (5 ng/ml) with or without T0901317 (5 μM) in starvation medium. a Cells were treated for 48 h and the cell viability was assessed by MTS assay. The graph reports the percentage of cell viability related to untreated cells transfected with siCtrl, which is set to 100%, as mean ± SD values. Experiments performed in biological triplicate, each of them in technical triplicate. b Hep3B cells were treated for 16 h, then caspase 3 cleavage assay was performed; quantification of caspase activity normalized to protein content per time unit is graphed as mean ± SD values. Experiments performed in biological triplicate, each of them in technical duplicate. c After 4 h of treatment, H2DCFDA fluorimetric quantification was performed. Data are presented as percentage vs. control, which is set to 100%, and are mean ± SD. Experiments performed in biological quadruplicate, each of them in technical duplicate. df Hep3B cells were incubated with or without T0901317 for 16 h; the expression of genes of interest was then analyzed by real-time PCR and the results are described as mean ± SD, with basal expression levels set to 1, corresponding to different absolute levels of BCL2, MCL1, or SNAI1 mRNA expression. Experiments performed in biological triplicate, each of them in technical triplicate. Statistical significance was assessed by one-way (b) or two-way (a, c-f) Anova. Significance was assigned as *p < 0.05, **p < 0.01, ***p < 0.001

References

    1. Majumdar A, Curley SA, Wu X, Brown P, Hwang JP, Shetty K, et al. Hepatic stem cells and transforming growth factor β in hepatocellular carcinoma. Nat Rev Gastroenterol Hepatol. 2012;9:530–8. doi: 10.1038/nrgastro.2012.114. - DOI - PMC - PubMed
    1. Dooley S, ten Dijke P. TGF-β in progression of liver disease. Cell Tissue Res. 2012;347:245–56. doi: 10.1007/s00441-011-1246-y. - DOI - PMC - PubMed
    1. Meindl-Beinker NM, Matsuzaki K, Dooley S. TGF-β signaling in onset and progression of hepatocellular carcinoma. Dig Dis. 2012;30:514–23. doi: 10.1159/000341704. - DOI - PubMed
    1. Fabregat I. Dysregulation of apoptosis in hepatocellular carcinoma cells. World J Gastroenterol. 2009;15:513–20. doi: 10.3748/wjg.15.513. - DOI - PMC - PubMed
    1. Murillo MM, Carmona-Cuenca I, Del Castillo G, Ortiz C, Roncero C, Sanchez A, et al. Activation of NADPH oxidase by transforming growth factor-β in hepatocytes mediates up-regulation of epidermal growth factor receptor ligands through a nuclear factor-κB-dependent mechanism. Biochem J. 2007;405:251–9. doi: 10.1042/BJ20061846. - DOI - PMC - PubMed

Publication types

MeSH terms